.avif)
10 Best Marketing Analytics Tools for 2026

.avif)
Your dashboard says paid search is efficient. Your CRM says pipeline came from webinars. Your product team swears activation is the bottleneck. Meanwhile, leadership wants one answer to a simple question that rarely has a simple answer: what's driving growth?
That's why your marketing analytics tool matters more than is often acknowledged. It doesn't just report performance. It shapes how your team allocates budget, how fast you spot problems, and whether marketing can connect activity to revenue with any credibility. A weak setup traps you in channel silos. A strong one gives you a working decision system.
The category has matured far beyond basic web reporting. Modern market roundups now split tools into architectures such as end-to-end platforms, data connectors, BI-first tools, and specialized point solutions, which reflects the shift from fragmented reporting to stack-wide measurement infrastructure, as described in Domo's guide to marketing analytics tools. If you're also revisiting channel priorities, this pairs well with a look at digital marketing trends for 2026.
Below, I've organized the best marketing analytics tools by job to be done: web analytics, product analytics, attribution, and SEO or competitive research. That's the only structure I've found that maps cleanly to real buying decisions.
Table of Contents
1. Google Analytics 4 (GA4)

GA4 is still the default starting point for web analytics, and for many, it's sufficient. It gives you an event-based model across web and app, strong Google Ads integration, and enough acquisition and conversion reporting to keep a lean marketing team moving without buying another platform first.
Its real value is as a baseline system of record for traffic and on-site conversion behavior. If your team needs to understand where visitors came from, what they did, and which pages or events correlate with conversion, GA4 covers the essentials well.
Where GA4 works best
GA4 fits best when your main questions are web-first:
- Acquisition clarity: You need to compare channels, campaigns, landing pages, and conversion paths.
- Google stack alignment: You already rely on Google Ads, Search Console, and BigQuery.
- Low-friction adoption: You want something that marketing and agency teams generally know how to access.
The catch is that GA4 isn't a full marketing analytics strategy. It's one layer. Once you need CRM-stage reporting, offline conversion stitching, or serious custom modeling, teams usually outgrow the interface and lean on exports or a second tool.
Practical rule: Use GA4 to answer website behavior questions. Don't force it to become your attribution warehouse.
What to watch before you commit
GA4 can frustrate teams that expect raw flexibility inside the product. Advanced analysis often pushes you toward BigQuery, and that's where the skill gap shows up. Sampling and thresholding can also make stakeholders distrust reports when totals don't line up the way they expect.
For small teams, none of that is a reason to skip it. It's a reason to use it for the right job. If you're early-stage, content-led, or running paid search and paid social into a site conversion flow, GA4 is usually the first tool I'd implement, not the last one I'd buy.
Website: Google Analytics 4
2. Adobe Analytics (Adobe Experience Cloud)
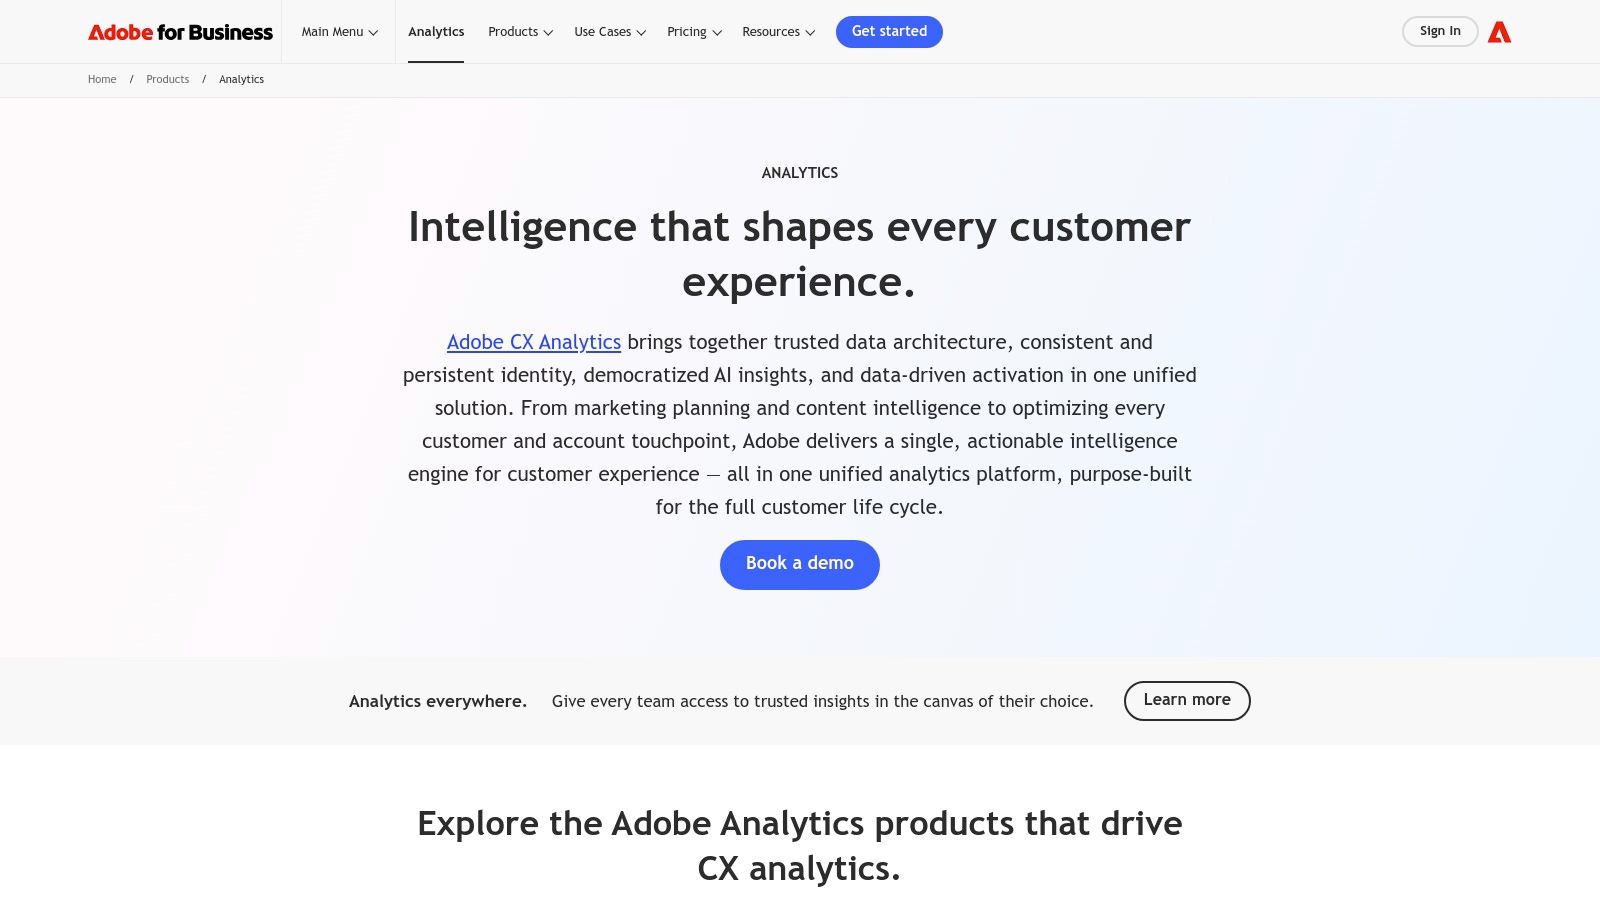
Adobe Analytics is what teams buy when GA4 starts feeling too rigid and the business has enough complexity to justify a more governed setup. It's built for deep segmentation, pathing, and cross-channel analysis across large digital estates, not quick plug-and-play reporting.
This is the tool for organizations with multiple brands, serious traffic, complicated user journeys, or internal analytics teams that need more control over how data is structured and explored. Power users tend to love Analysis Workspace because it lets them slice behavior in ways lighter tools don't.
Why enterprise teams choose it
Adobe Analytics earns its place when the organization needs granularity and governance at the same time. That combination matters more as teams expand across regions, business units, and channels.
A few strengths stand out:
- Segmentation depth: Analysts can build highly specific audience cuts without constantly rebuilding reports.
- Journey analysis: Pathing and attribution work well when the business has long, messy digital journeys.
- Governance: Permissions, data collection controls, and enterprise-grade administration are much stronger than what most mid-market tools offer.
That flexibility comes with real overhead. Implementation isn't light. Maintenance isn't light. If nobody owns analytics engineering or tagging discipline internally, Adobe often becomes underused.
Adobe Analytics is excellent when your business is complex enough to need it. It's expensive shelfware when your reporting questions are still basic.
Best fit by company stage
I wouldn't recommend Adobe to a startup or even most mid-market teams unless they already operate like an enterprise. It makes the most sense when analytics is shared across marketing, product, digital experience, and leadership, and when there's a dedicated owner for instrumentation and governance.
If your stack already includes Adobe Experience Cloud products, the case gets stronger. If not, you should be honest about whether you need enterprise analysis or just better reporting hygiene.
Website: Adobe Analytics
3. Mixpanel
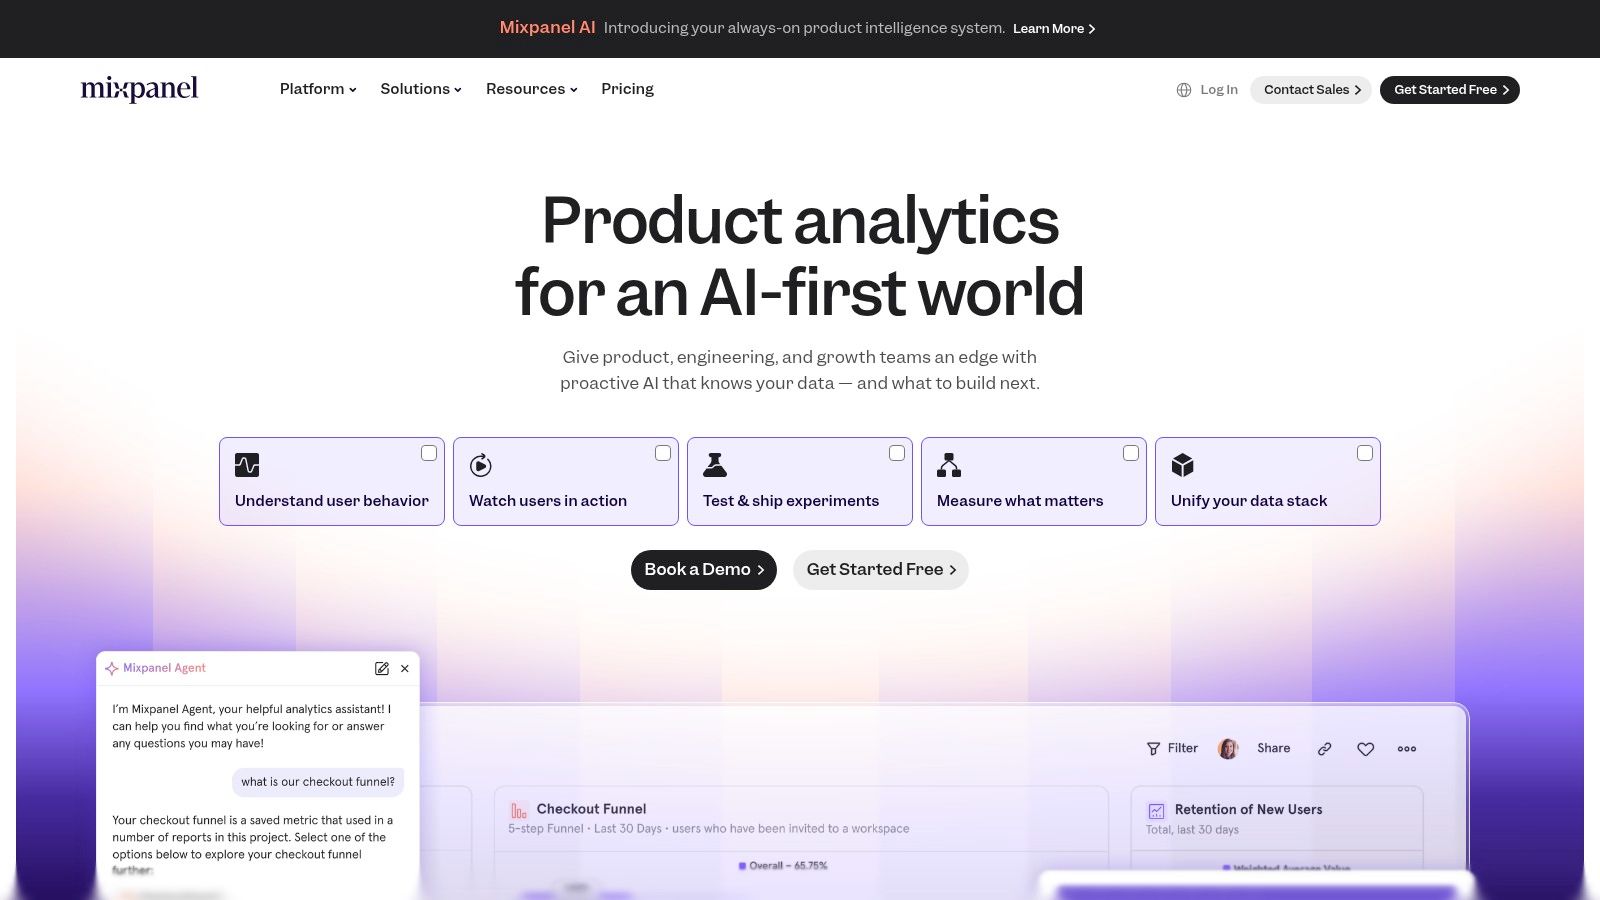
Mixpanel sits in the product analytics camp, but marketers increasingly use it because growth doesn't stop at acquisition anymore. If you need to understand whether a campaign brought in users who activated, retained, and returned, Mixpanel is far more useful than a traffic-only tool.
Its interface is one of the best in the category for repeated self-serve use. Teams can build funnels, retention views, cohorts, and user flows quickly, which matters because analytics only helps when people engage with the tool.
Where Mixpanel beats web analytics tools
Mixpanel shines when the business model depends on post-click behavior. SaaS, apps, marketplaces, and product-led B2B teams usually care less about pageviews and more about milestones such as signup completion, workspace creation, invite sent, or feature adoption.
That's where Mixpanel earns its place:
- Funnels and retention: You can see where users stall after signup and which channels bring people who stick.
- Cohorts: Marketers can build segments based on actual behavior, not just source or campaign tags.
- Fast exploration: The UI encourages habitual use by growth, lifecycle, and product teams.
This is also where teams make a common mistake. They buy Mixpanel expecting revenue attribution. It can support campaign reporting, but product analytics and revenue attribution are not the same problem.
The trade-off most teams feel later
Event-based pricing can get messy when instrumentation is noisy. If engineers track everything without a naming plan, the bill and the taxonomy both get ugly. Mixpanel works best when someone owns the event model and keeps it clean.
Recent market coverage also draws a clearer line between product analytics and attribution. Tools like Mixpanel and Amplitude are framed around engagement, feature usage, and retention, while platforms such as Ruler Analytics or HockeyStack are positioned around connecting marketing and sales data to deals, as outlined in G2's overview of marketing analytics tools.
Website: Mixpanel
4. Amplitude
Amplitude is the product analytics tool I'd put in front of teams that want a broader digital analytics workspace, not just funnels. It covers behavioral analysis, audiences, replay, experimentation, and feature-related workflows in a way that can reduce tool sprawl if product and marketing work closely.
For growth teams, the key appeal is context. You can connect acquisition with usage patterns and make decisions based on what users do after they arrive, not just whether they converted on day one.
Why growth teams like it
Amplitude tends to work well when a company is serious about product-led growth or hybrid growth. Marketing can see who activated. Product can see what acquisition sources bring higher-intent users. Lifecycle teams can build segments around behavior instead of assumptions.
That's especially useful when your CRM or lead scoring needs stronger input from product activity. Clean profiles and better firmographic context also help, which is why many teams pair behavior tracking with B2B data enrichment tools to improve audience quality upstream.
A few practical strengths stand out:
- Suite breadth: Analytics, experimentation, and activation are closer together than in many competing stacks.
- Templates: Smaller teams can get moving without designing every report from scratch.
- Cross-functional value: Product, growth, and marketing can work from the same behavioral language.
Where it can disappoint
Amplitude isn't effortless. Plan limits around users, events, and retention need planning before adoption expands. Some of the more advanced permissions and testing workflows also sit higher in the product ladder.
For pure marketing teams with little product involvement, it can feel like too much platform. But if your growth model depends on feature adoption, activation, and expansion, Amplitude is one of the best marketing analytics tools because it forces the team to optimize for behavior, not vanity metrics.
Website: Amplitude
5. Heap (by Contentsquare)
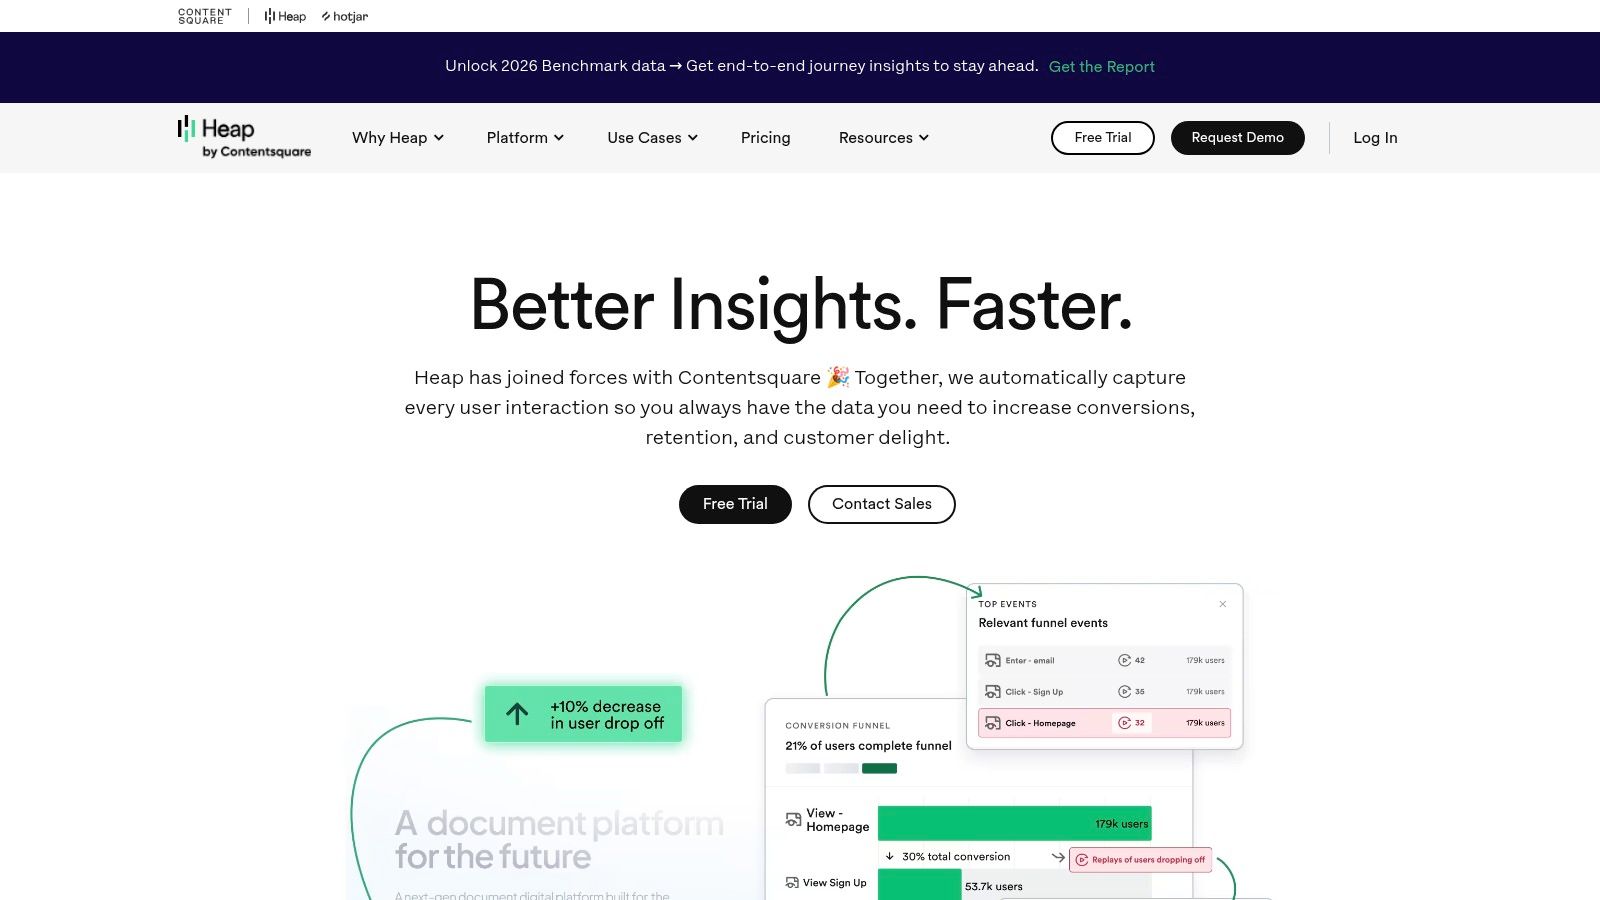
Heap is the tool I reach for when a team knows its tracking is incomplete and doesn't want to wait through a long instrumentation backlog. Its autocapture model lowers the setup burden and lets teams analyze user behavior retroactively, which is a real advantage when nobody can confidently say every important event was tagged correctly from day one.
That speed-to-insight matters in messy environments. If marketing, product, and web teams all move fast, Heap often gives you usable answers sooner than a manual event taxonomy project.
What Heap is great at
Heap is strongest when the immediate need is visibility, not perfect event architecture. Journeys, funnels, retention, and replay-style analysis come together quickly, and non-technical users can label important interactions visually.
That usually makes it a strong fit for:
- Early product analytics adoption: Teams need answers before they have pristine instrumentation.
- Website and product overlap: Marketers want to study on-site behavior beyond standard analytics reports.
- Stakeholder buy-in: Autocapture helps teams show value fast, which makes broader analytics investment easier.
Heap also works well when leaders are still deciding which behaviors matter most. Because retroactive analysis is possible, you don't have to predict every future question in advance.
Where Heap needs discipline
Autocapture is helpful, but it can also create clutter. Without governance, teams collect more than they can interpret, and the interface starts filling with loosely defined events that mean different things to different people. That's not a Heap-specific flaw. It's the cost of speed.
If your organization needs strict control over what gets tracked, how events are named, and who can define metrics, a more deliberate setup may fit better. But for teams trying to move from “we think users are dropping here” to “we know exactly where they leave,” Heap is practical and fast.
Website: Heap
6. HubSpot Marketing Hub (analytics and attribution)
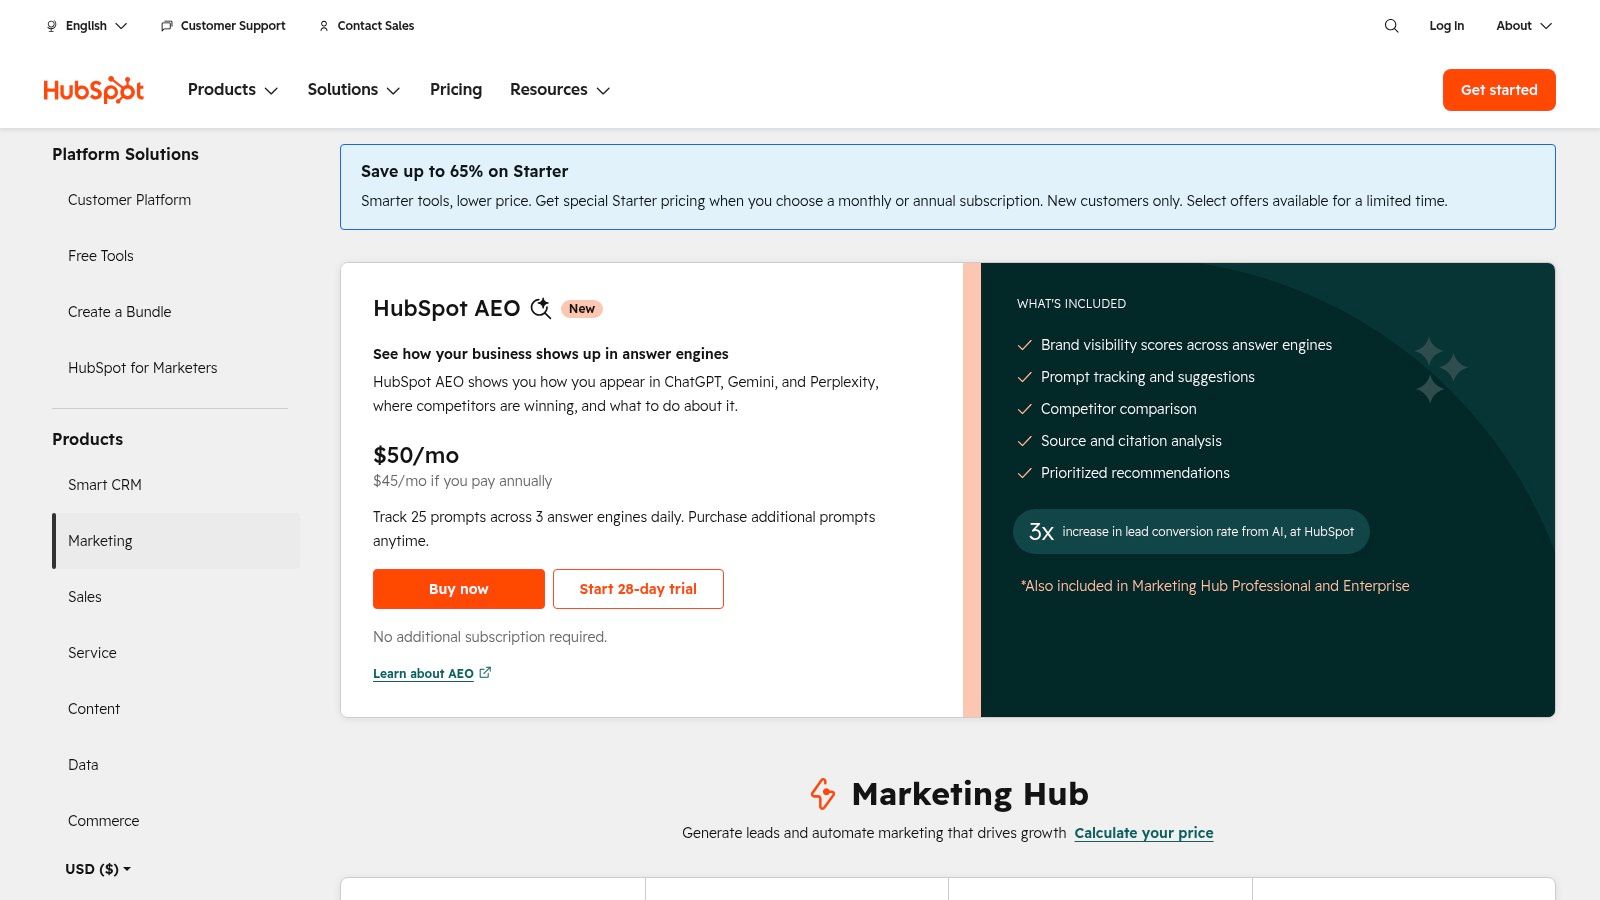
HubSpot is the cleanest answer for B2B teams that want analytics close to the CRM, not stitched together across five tools. If your campaigns, forms, lifecycle stages, and deals already live in HubSpot, its reporting layer can answer a lot of pipeline questions without a heavier attribution platform.
That's why it keeps showing up in best marketing analytics tools lists even though it isn't trying to be everything. It's useful because it's operational, not because it has the deepest analysis engine.
Best use case for HubSpot
HubSpot is strongest for companies that run inbound, lifecycle, and demand generation from a single CRM-centric workflow. It unifies campaign analytics across channels and ties reporting back to contacts, deals, and revenue objects in a way that many B2B teams can act on immediately.
This gets even more valuable when your records are clean. If you're building reports on incomplete contacts and weak company data, attribution quality drops fast. That's one reason revenue teams often pair CRM-native reporting with marketing database software that keeps records more complete.
Practical trade-offs
HubSpot's biggest strength is also its limit. It's excellent when your process already fits the platform. It's less convincing when the company uses multiple CRMs, offline sales motions, or complex cross-system reporting.
Salesforce's own 2026 guidance also emphasizes automation and harmonization across online and offline sources, which is a useful reminder that enterprise measurement often outgrows a single app's native reporting layer. For mid-market B2B, though, HubSpot often lands in the sweet spot between simplicity and revenue visibility.
If your team asks “which campaigns influenced deals?” more often than “what's the ideal multi-model attribution setup?”, HubSpot is often enough.
Website: HubSpot Marketing Hub pricing and analytics
7. Matomo (cloud and on-premise)

Matomo earns attention for one reason above all: control. If your organization cares significantly about privacy, data ownership, and deployment flexibility, it solves a different problem than GA4 or Adobe. It isn't just another analytics dashboard. It's an answer to the question, “Where does our analytics data live, and who controls it?”
That matters in regulated sectors, in public institutions, and in companies that don't want to send core behavioral data into a third-party ecosystem by default.
Why privacy-led teams choose Matomo
Matomo covers the core jobs most web teams need. You get analytics, campaigns, events, attribution, and custom reporting, plus optional extensions for more advanced UX analysis. The difference is architectural. You can deploy it in the cloud or on-premise and keep tighter control over the stack.
The broader market also points toward cloud-first buying. The global marketing analytics market is estimated at USD 8.02 billion in 2026 and projected to reach USD 14.55 billion by 2031 at a 12.65% CAGR, while cloud deployments held 61.58% share in 2025, according to Mordor Intelligence's marketing analytics market analysis. Matomo matters because it gives teams a credible alternative when cloud-first isn't the whole requirement.
What teams should be realistic about
Matomo is a strong fit when legal, governance, or data residency concerns are part of the buying process. That usually goes hand in hand with broader compliance work, including a practical understanding of what GDPR requires.
The trade-off is ecosystem depth. You won't get the same surrounding connector universe or default familiarity that comes with Google's products. If your main priority is easy handoff to agencies and common ad-platform workflows, GA4 will usually be simpler. If your main priority is ownership and privacy posture, Matomo becomes much more compelling.
Website: Matomo
8. Semrush
Semrush belongs in this list because marketing analytics isn't only about attribution and dashboards. Some teams need to answer a different set of questions: where can we win in search, which competitors are gaining visibility, and which content opportunities are likely worth producing next?
For SEO and content-led companies, those are core analytics questions. Semrush gives you keyword research, domain analysis, rank tracking, site audits, backlinks, and competitive monitoring in one place.
When Semrush is the right kind of analytics tool
Semrush is best when organic search is a meaningful growth channel and your team needs competitive intelligence, not just internal performance reporting. It's particularly useful for content programs, inbound B2B, and search-heavy e-commerce teams.
You use it to make decisions such as:
- Content prioritization: Which topics are realistic targets versus pure wish lists.
- Competitive monitoring: Which domains are gaining traction in your core categories.
- Technical hygiene: Which site issues are likely suppressing search performance.
- Paid and organic overlap: Where keyword and domain insight can inform both SEO and paid search planning.
This is an external lens, not a system of record for conversions or revenue. That's why I rarely recommend Semrush as a stand-alone analytics stack. It's a specialist.
What it won't do well
Third-party traffic estimates are directional, not ground truth. That's useful when you treat them as market signals and misleading when someone turns them into board-level fact. Also, costs can rise as teams add users and adjacent toolkits.
Still, if content and search are major growth levers, Semrush is one of the best marketing analytics tools because it helps teams allocate effort before they publish, not only after results arrive.
Website: Semrush pricing
9. AppsFlyer
AppsFlyer is built for teams that live in app acquisition, mobile attribution, and cross-platform performance measurement. If your growth motion depends on installs, re-engagement, deep links, and mobile media efficiency, general web analytics tools won't get you far enough.
Many teams often underbuy. They try to run mobile measurement through web-style reporting and then wonder why their attribution picture is incomplete.
What AppsFlyer does better than general tools
AppsFlyer is designed around mobile and cross-platform measurement. It handles app-focused attribution, deep linking, fraud protection, audience segmentation, and broader measurement across app, web, and connected environments.
That makes it a practical fit for:
- App-first growth teams: You need install and post-install measurement tied to campaign sources.
- Performance media buyers: You care about creative, channel, and retargeting efficiency across mobile environments.
- Cross-platform brands: Users move between web, app, and other touchpoints, and you need something built for that reality.
It's also useful because it treats implementation as infrastructure, not just reporting. That sounds obvious, but in mobile measurement it matters a lot.
The cost of getting it half-right
AppsFlyer can be heavy for small teams. Setup depth, partner integrations, and add-on structure mean you need a real measurement owner, not just a dashboard consumer. But if app growth is central to the business, that investment usually beats under-attributing paid media and making budget calls on partial data.
For web-led B2B firms, this is overkill. For app-driven businesses, it's often foundational.
Website: AppsFlyer
10. Northbeam
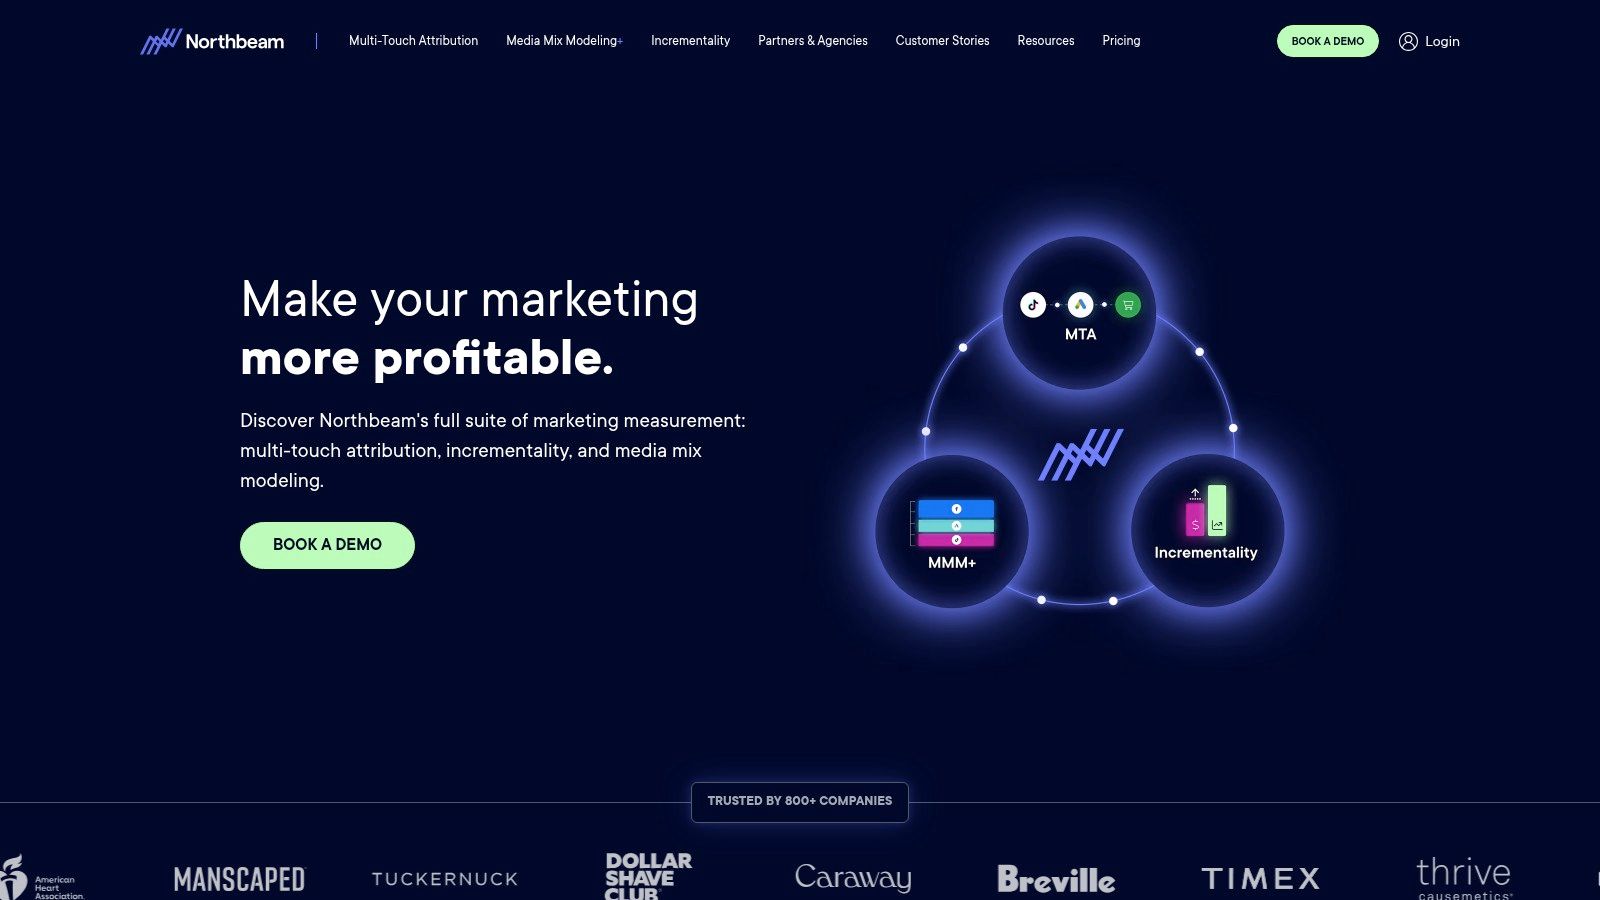
Northbeam is purpose-built for brands that need to measure paid media profitability beyond platform-reported conversions. In practice, that usually means e-commerce teams spending heavily across Meta, Google, TikTok, retail media, and creative testing workflows.
This is not a general analytics tool. It's a decision engine for performance marketing and budget allocation.
Why Northbeam stands out
Northbeam combines multi-touch attribution, media mix modeling, incrementality thinking, and creative analytics in one workflow. That matters because performance teams rarely need one neat dashboard. They need a way to compare what platforms claim, what blended performance suggests, and where the next budget shift should go.
A broader market reality supports why these platforms exist. Tool selection now increasingly depends on architecture and operating model, with evaluations focusing on integration depth, data movement overhead, and total cost of ownership, not just visualization features, as outlined in Improvado's breakdown of marketing analytics tool architectures. Northbeam fits the specialized end of that spectrum.
Best fit by business goal
Northbeam makes the most sense when your core questions are spend allocation and marginal efficiency. It's especially relevant for brands that need a tighter read on creative performance and channel interaction than native ad dashboards provide.
I'd map it like this:
- Best for e-commerce brands: Paid media is a primary revenue lever.
- Best for performance operators: Budget planning and creative decisions happen weekly, sometimes daily.
- Not ideal for CRM-heavy B2B: If your sales cycle runs through meetings, opportunities, and offline stages, you likely need revenue attribution tied to CRM objects instead.
One practical note on pricing. Sales-led pricing is common in this tier, and pricing spread across the category can be wide. Ruler Analytics' 2026 review lists plans from £199 per month for small businesses up to £1,149 per month for enterprise customers, which is a good reminder that scale, integrations, and attribution depth change tool economics quickly in this market, as shown in Ruler Analytics' review of marketing analytics tools.
Website: Northbeam
Top 10 Marketing Analytics Tools Comparison
| Product | ✨ Core features | Data & integrations | ★ UX & analysis | 👥 Target audience | 💰 Pricing/value |
|---|---|---|---|---|---|
| Google Analytics 4 (GA4) | Event-based cross-platform; ML insights; Google Ads native ✨ 🏆 | BigQuery, Ads, Search Console; shareable reports | ★★★★☆, solid baseline; advanced needs BigQuery | 👥 Marketers, ad teams, SMBs | 💰 Free core; BigQuery/export costs |
| Adobe Analytics (Experience Cloud) | Enterprise segmentation & journey analysis; person-level attribution ✨ 🏆 | Real‑Time CDP, Customer Journey Analytics; strong governance | ★★★★★ power; steep learning curve | 👥 Large enterprises, analytics teams | 💰 Enterprise pricing; no free tier |
| Mixpanel | Product funnels, retention, cohorts; fast self-serve analysis ✨ 🏆 | Warehouse connectors; campaign attribution | ★★★★☆, excellent UI; quick queries | 👥 SaaS growth, experimentation teams | 💰 Flexible scale; event-based billing can spike |
| Amplitude | Product + experimentation + feature flags; activation templates ✨ 🏆 | MTU/event plans; unlimited sources/destinations | ★★★★☆, broad suite; good starter plan | 👥 Product-led teams, startups → enterprise | 💰 Starter Plus affordable; enterprise tiers pricier |
| Heap (by Contentsquare) | Autocapture & retroactive analysis; Sense AI summaries ✨ 🏆 | Warehouse integrations; governance & security | ★★★★☆, fast time‑to‑insight; guided analysis | 👥 PMs & analysts needing quick answers | 💰 Solid free tier; mid/advanced features cost more |
| HubSpot Marketing Hub | CRM-native campaign analytics & multi-touch attribution ✨ 🏆 | Ads integrations; CRM-level reporting & dashboards | ★★★★☆, strong OOTB reporting; advanced on higher tiers | 👥 B2B marketers using HubSpot CRM | 💰 Contact-based pricing; Pro/Ent features costly |
| Matomo (cloud & on‑prem) | Privacy-first analytics; full data ownership; no sampling ✨ 🏆 | On‑prem/cloud EU hosting; plugins & Tag Manager | ★★★★☆, compliant & controlled; plugins add UX features | 👥 Orgs prioritizing GDPR/CCPA & data control | 💰 Self-host low cost; cloud/plugins may add fees |
| Semrush | SEO, keyword & competitor research; site audits & backlinks ✨ 🏆 | Large search datasets; SEO & content toolkits | ★★★★☆, broad toolset; learning curve for depth | 👥 SEO, content & digital marketing teams | 💰 All-in-one suite; add-ons/users increase cost |
| AppsFlyer | Mobile & cross-platform attribution; fraud protection & deep linking ✨ 🏆 | Wide ad platform integrations; deep linking suite | ★★★★☆, enterprise-grade; implementation heavy | 👥 App growth & performance marketing teams | 💰 Complex, add-on pricing; enterprise-focused |
| Northbeam | E‑commerce MTA + MMM + incrementality; creative analytics ✨ 🏆 | Deep ad integrations (Meta, Google, TikTok); modeled signals | ★★★★☆, purpose-built for ROAS optimization | 👥 E‑commerce & performance marketing teams | 💰 Sales-led pricing; not transparently listed |
From Data to Decisions Building a Measurement Culture
Monday morning. The growth meeting starts, and three teams bring three different answers to the same question. Paid media reports efficient acquisition. Product points to weak activation. Sales argues that lead quality slipped before opportunities were created. The problem usually is not tool coverage. It is a measurement system with unclear ownership, inconsistent definitions, and no agreed path from metric to decision.
The fastest way to fix that is to assign each tool category a job. Web analytics tools support traffic, conversion path, and landing page decisions. Product analytics tools support onboarding, feature adoption, and retention decisions. Attribution platforms support budget allocation across channels. SEO and competitive tools support demand discovery, content planning, and share-of-search analysis.
That functional model also maps well to company stage. Early-stage teams usually need dependable web measurement before they add more software. Product-led companies get more value from tying acquisition to activation and retention. B2B organizations need CRM-connected reporting that holds up in pipeline reviews. E-commerce brands with rising paid spend often need stronger attribution because ad platform reporting stops being enough once channel mix gets more complex.
Buy for the bottleneck you have now.
A simple decision filter works well here. Identify the business decision that is repeatedly slow, disputed, or wrong. If teams argue about site performance, start with web analytics. If the underlying issue is activation or churn, invest in product analytics. If the debate is where to put the next dollar, prioritize attribution. If planning depends on search demand, competitor movement, or content gaps, use an SEO and competitive platform.
Tool selection matters, but operating discipline matters more. Every team needs clear metric ownership, naming rules, and a reporting cadence tied to actual decisions. It also helps to define the source of truth for each metric. Without that, GA4, Amplitude, HubSpot, Northbeam, and Semrush can all produce reasonable answers and still create confusion in weekly reviews.
A practical rollout looks like this:
- Start with one decision loop. Build around the question leadership asks every week.
- Assign metric ownership. Name the person or team responsible for traffic, conversion, pipeline, retention, and revenue reporting.
- Standardize identifiers. Keep UTMs, campaign names, account IDs, and lifecycle stages consistent across systems.
- Audit input quality. Weak CRM records, bad form fills, and missing fields break attribution and segmentation before reporting starts.
- Train teams on use, not access. Dashboards should support planning, budget reviews, and postmortems.
For B2B teams, contact and company data quality directly affects measurement quality. Incomplete records create gaps in attribution, weaken segmentation, and make pipeline reporting harder to trust. A platform like Icypeas can support cleaner enrichment inputs for CRM and reporting workflows when firmographic accuracy matters.
The goal is faster decisions with enough confidence to act. Choose the category that matches the decision your team needs to improve first. Then build the ownership model, data rules, and review habits that turn analytics from reporting output into a management system.


































































.png)



.webp)