.avif)
Marketing Data Warehouse: A Complete Guide for 2026

.avif)
You're probably dealing with this right now. The VP of Marketing wants a clean answer to a simple question like, “What did it cost us to acquire customers last quarter?” Paid search shows one number. Meta shows another. Salesforce has opportunities that don't line up with campaign names. GA4 reports conversions that nobody fully trusts. Someone exports CSVs, someone else fixes naming in a spreadsheet, and by the time the deck is ready, the numbers are already stale.
That's the point where teams typically realize they don't have a reporting problem. They have a data architecture problem.
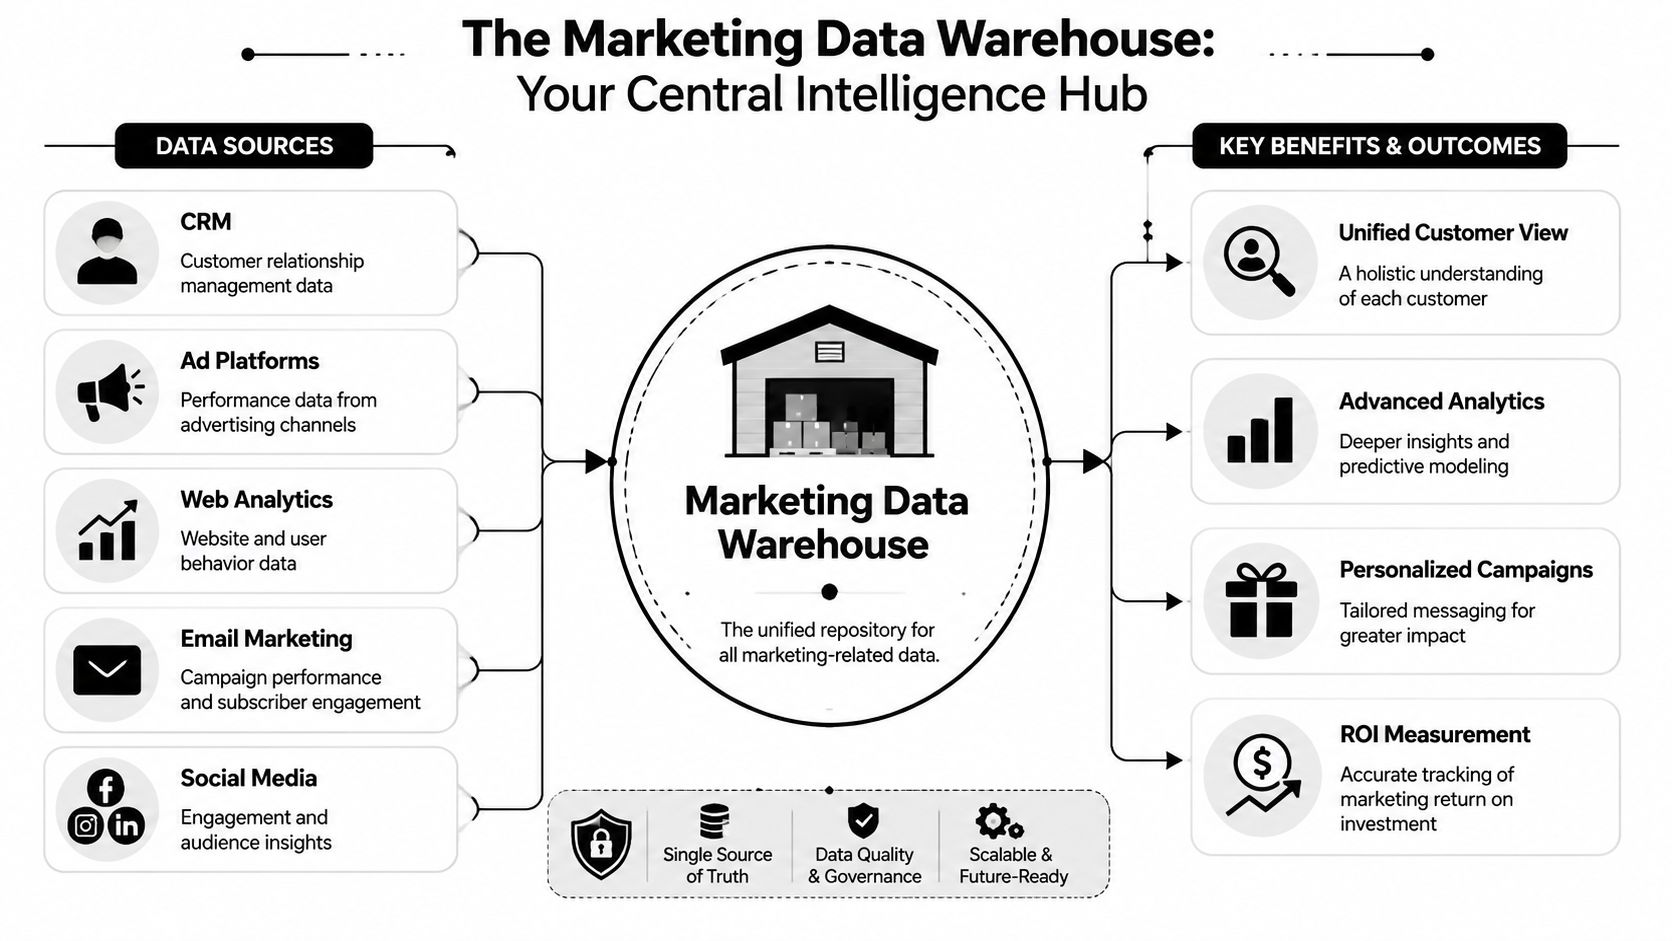
A marketing data warehouse fixes that by giving marketing, ops, analytics, and engineering a shared system for storing, organizing, and analyzing data across channels over time. It turns disconnected platform reporting into a model you can use for budgeting, attribution, forecasting, and customer analysis.
Table of Contents
The Modern Marketer's Data Dilemma
Most marketing teams don't start by asking for a warehouse. They start by asking for a dashboard.
Then the dashboard project encounters the main problem. Google Ads names a campaign one way, Salesforce stores the source another way, LinkedIn data arrives with different grain, and offline conversions show up late or not at all. The team spends more time reconciling data than using it.
That's why so many “single source of truth” projects stall. The issue isn't effort. It's that source platforms were built for operating their own channel, not for giving you a reliable cross-channel history.
A warehouse becomes necessary when the business needs answers that no single platform can provide on its own:
- Blended acquisition cost across paid and owned channels
- Funnel visibility from click to lead to opportunity to revenue
- Historical reporting that survives retention limits and platform changes
- Shared definitions so finance, sales, and marketing stop arguing over the same metric
The broader market has moved in this direction too. The shift to cloud-based storage and analytics is central to the modern warehouse model, and one forecast says the cloud data warehouse market will reach $95.78 billion by 2032, growing at about a 23.5% CAGR from 2023 to 2030, according to Firebolt's cloud data warehouse statistics and trends roundup.
That matters because cloud infrastructure changed the economics of centralization. Teams no longer need to treat warehousing like a heavy back-office IT project. They can use it as a practical decision layer for marketing.
If you're still trying to compare platform exports manually, start by mapping your core marketing data sources. That exercise usually reveals the actual problem fast: too many systems, too many definitions, and no durable place where the data belongs together.
A spreadsheet can summarize performance. It can't govern it.
What Exactly Is a Marketing Data Warehouse
A marketing data warehouse is an analytical system that stores structured data from your marketing, sales, and customer tools so people can query it over time. It's built for analysis, not for running day-to-day transactions.
Technically, it's an OLAP-oriented system. That means it's designed for complex analytical queries over large, integrated datasets rather than operational processing. It's also typically subject-oriented, time-variant, and non-volatile, which is why it works so well for historical marketing analysis, as explained in Improvado's marketing data warehousing guide.
Think of it as a central library
The simplest analogy is a library.
Your CRM is like the checkout desk. It tracks active records and current interactions. Your ad platforms are like separate publishers. Each one prints its own version of events. Your analytics tool is a reading room with useful summaries, but only for what it can see.
The marketing data warehouse is the library itself. It stores the catalog. It keeps older records. It organizes information around subjects like customer, campaign, account, touchpoint, and revenue event. And it makes that information available for deeper analysis later.
That's why a warehouse tends to become more valuable over time. Every month of clean, connected history makes analysis sharper. You're not just storing campaign results. You're building institutional memory.
If you need a plain-English companion to this concept, Querio has a solid practical data warehouse explainer detailing the general mechanics without drowning the reader in jargon.
What it is not
A lot of teams confuse the warehouse with nearby systems. That usually leads to bad design decisions.
| System | Best at | Not best at |
|---|---|---|
| CRM | Managing active accounts, contacts, pipeline | Heavy historical analysis across channels |
| Ad platform UI | Channel execution and in-platform reporting | Cross-platform measurement |
| CDP | Audience collection and activation workflows | Deep warehouse-style analytics on broad business history |
| Marketing data warehouse | Historical analysis, unified reporting, modeling | Running campaign operations directly |
A warehouse also isn't a magic box that fixes bad source data on arrival. It needs rules, modeling, and ownership.
That's one reason teams often evaluate the warehouse alongside a marketing data platform. The platform handles collection and movement. The warehouse holds the durable analytical layer where business logic becomes consistent.
Practical rule: If a system's main job is sending emails, updating pipeline stages, or serving ads, it isn't your source of analytical truth.
Anatomy of the Modern Data Architecture
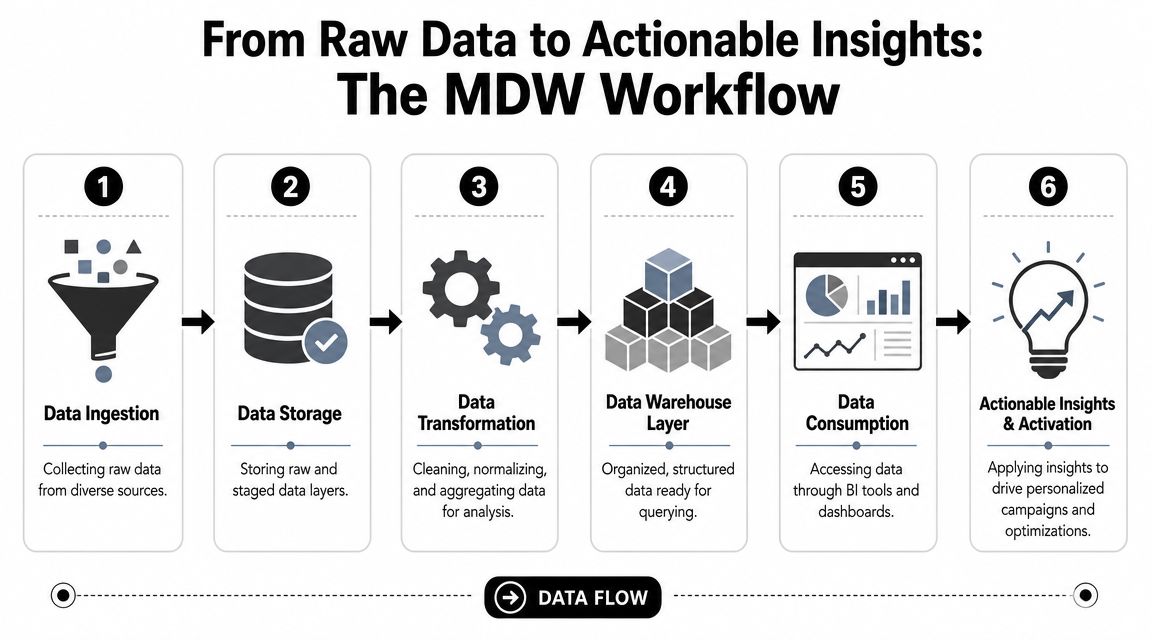
A marketing data warehouse isn't one tool. It's a workflow. Data moves through layers, and each layer has a different job. When teams skip one, the whole setup gets brittle.
Modern marketing warehouses are commonly built to unify data from hundreds of sources, including Google Ads, Facebook, Google Analytics, HubSpot, and Salesforce, while preserving history that source systems may not retain indefinitely, as described in Funnel's explanation of marketing data warehouses.
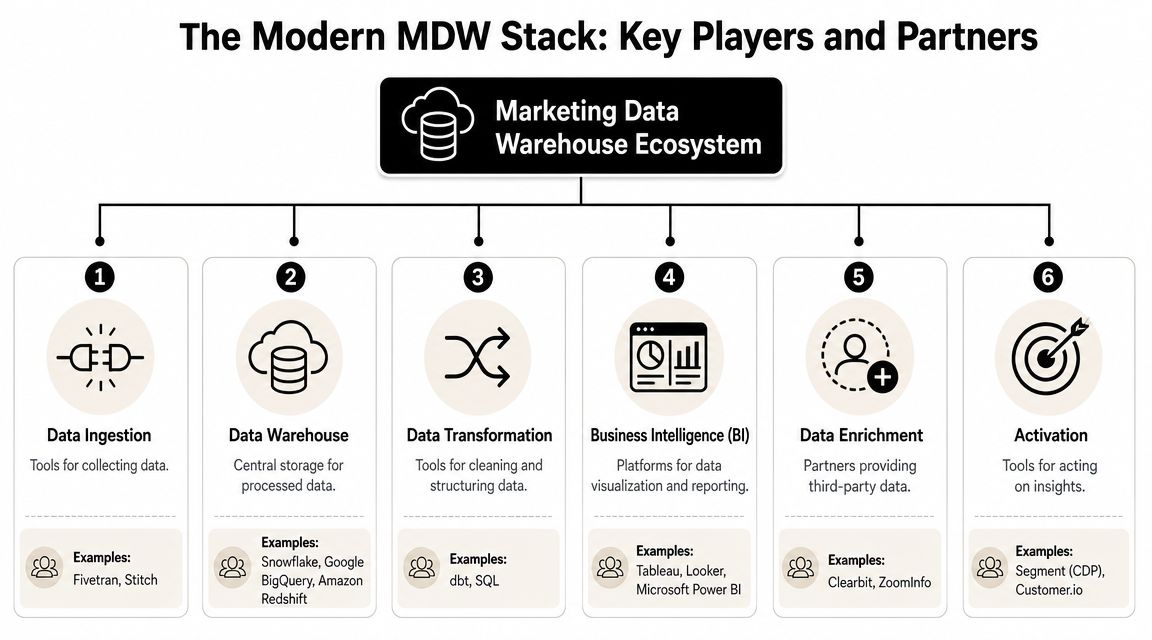
The four working layers
Start with the source systems. These are your ad platforms, CRM, email platform, product analytics tool, web analytics setup, ecommerce system, and sometimes finance data. This layer is messy by nature. APIs change. Naming conventions drift. Fields appear and disappear.
Next comes ingestion, during which ETL or ELT tools pull data into a central environment. Teams might use Fivetran, Airbyte, Stitch, custom scripts, or vendor-specific connectors. The key decision here isn't just “Can it connect?” It's “Who will maintain this when schemas change?”
Then comes storage and modeling inside the cloud warehouse itself. In this phase, raw tables become useful tables. You normalize campaign names, align date logic, join spend to sessions, connect leads to opportunities, and create reporting models that analysts and BI tools can query without rewriting business logic every week.
Finally, there's activation and consumption. That includes BI tools like Looker, Tableau, or Power BI. It can also include reverse ETL tools that send modeled audiences or account signals back into Salesforce, HubSpot, or ad platforms.
A clean way to think about it is this:
Sources create raw signals
Clicks, impressions, sessions, form fills, MQLs, meetings, opportunities, orders.Pipelines move those signals
Connectors and jobs extract data and land it in the warehouse.Models turn signals into meaning
SQL and transformation logic make “campaign performance” or “pipeline by source” queryable.Business tools use the outputs
Dashboards, planning models, audience syncs, and alerts rely on the modeled layer.
Where teams usually get stuck
Most failures happen in the middle, not at the beginning.
Connecting sources feels like progress, but raw ingestion alone doesn't produce useful reporting. If you pull Google Ads, Meta, GA4, and Salesforce into the same warehouse without normalization, you've just centralized inconsistency.
Three trade-offs matter more than teams expect:
ETL versus ELT
ETL transforms before loading. ELT loads first and transforms inside the warehouse. ELT gives analysts and engineers more flexibility, but it also assumes you have discipline around modeling and governance.Raw data versus curated data
Keep the raw layer. Always. But don't ask business users to work in it. They need modeled tables with stable definitions.Speed versus control
No-code connectors can get you moving fast. Custom pipelines offer control. The right choice depends on internal engineering capacity and how often your sources change.
If your BI layer is querying raw API tables directly, the warehouse isn't finished. It's still under construction.
A healthy architecture separates concerns. Sources feed staging. Staging feeds modeled storage. The presentation layer serves dashboards and downstream tools. That separation keeps ingestion jobs, transformation work, and BI queries from stepping on each other.
Strategic Benefits and Powerful Use Cases
A good marketing data warehouse changes how teams decide, not just how they report. The strategic value shows up when marketers stop asking, “What happened in this channel?” and start asking, “What happened across the customer journey?”
Where the warehouse changes decisions
One common use case is the unified customer view. A prospect clicks a paid search ad, returns later from organic search, signs up through a webinar, speaks with sales, and converts after an outbound touch. No single platform owns that story. The warehouse lets you reconstruct it.
Another is attribution analysis. Attribution analysis often reveals that platform-native reporting is useful for optimization inside a channel, but weak for cross-channel measurement. If you're refining attribution logic, mastering marketing attribution is a useful companion resource because it forces the right question: what decision are you trying to support with the model?
A warehouse also improves:
- Budget allocation by letting teams compare channels against shared outcomes
- Journey analysis by connecting first touch, mid-funnel engagement, and closed revenue
- Segmentation using behaviors from product, web, CRM, and campaign systems together
- Executive reporting because finance and marketing can pull from the same modeled data
That last point is underrated. The warehouse often matters most when marketing needs credibility with people outside marketing.
Why enrichment matters
Raw event data tells you what happened. Enrichment helps explain who was involved and whether that person or account fits your market.
That matters a lot in B2B. A form fill with just an email address is often not enough for routing, scoring, prioritization, or account analysis. Once the warehouse connects behavioral data with enriched contact and company attributes, teams can build more useful segments and cleaner lifecycle reporting.
Here's where enrichment provides an advantage:
Lead qualification
Match inbound signups to company and role data so sales doesn't chase poor-fit records.Account prioritization
Combine campaign engagement with firmographic context to identify accounts worth escalation.Lifecycle measurement
Track how specific roles, account types, or market segments move through the funnel.Personalization inputs
Feed cleaner customer and prospect attributes into outbound, paid, and sales workflows.
The warehouse gives you one record of performance. Enrichment makes that record more usable.
Without enrichment, teams often end up with anonymous or thin records that limit analysis. With it, campaign and CRM data become far more actionable, especially in account-based and demand generation programs.
Building Your Unified Analytics Framework
A warehouse pays off when you stop organizing reporting around platforms and start organizing it around the business.
That means fewer conversations about vanity metrics in isolation and more conversations about cost, conversion efficiency, sales impact, and retained value. Clicks and opens still matter, but mostly as diagnostic signals. They shouldn't be the top layer of the reporting model.
From channel metrics to business metrics
The right framework usually starts with a small set of executive questions.
| Business question | Warehouse view required |
|---|---|
| What does acquisition actually cost across channels? | Spend joined to lead, opportunity, and customer outcomes |
| Which campaigns influence qualified pipeline? | Campaign touchpoints mapped to CRM stages |
| Where does the funnel slow down? | Stage-based conversion analysis across sources |
| Which segments create durable revenue? | Customer and account traits joined to revenue history |
Once those questions are clear, the warehouse model needs a few reliable dimensions: date, campaign, channel, account, contact, lifecycle stage, and revenue event. If those dimensions aren't stable, your KPI layer won't be stable either.
The practical shift is from channel-owned metrics to blended metrics. Instead of asking Meta for CAC and Google Ads for CAC, you define acquisition cost centrally. Instead of relying on one platform's conversion logic, you map outcomes to your own lifecycle model.
Questions a strong framework can answer
A good unified analytics framework answers questions that siloed tools struggle with:
- Which channels generate leads sales processes
- Which campaigns create pipeline velocity versus just top-funnel volume
- How long it takes different segments to move from inquiry to revenue
- Whether paid performance improves or worsens when branded demand changes
- How marketing-sourced and marketing-influenced revenue differ
Teams often need discipline more than more data. Don't create a KPI zoo. Pick a tight set of metrics that connect activity to business outcomes.
A practical sequence looks like this:
- Define revenue-aligned outcomes such as qualified pipeline, sourced revenue, influenced revenue, or retained revenue.
- Map ownership so marketing ops, rev ops, and finance agree on definitions.
- Model the funnel once in the warehouse, not separately in every dashboard.
- Use platform metrics as supporting evidence, not as the final answer.
Field note: If two executives can each produce a different CAC number and both are technically “right,” your measurement model isn't mature enough yet.
The best warehouse reporting doesn't just show performance. It clarifies accountability.
Your Implementation Roadmap and How to Avoid Pitfalls
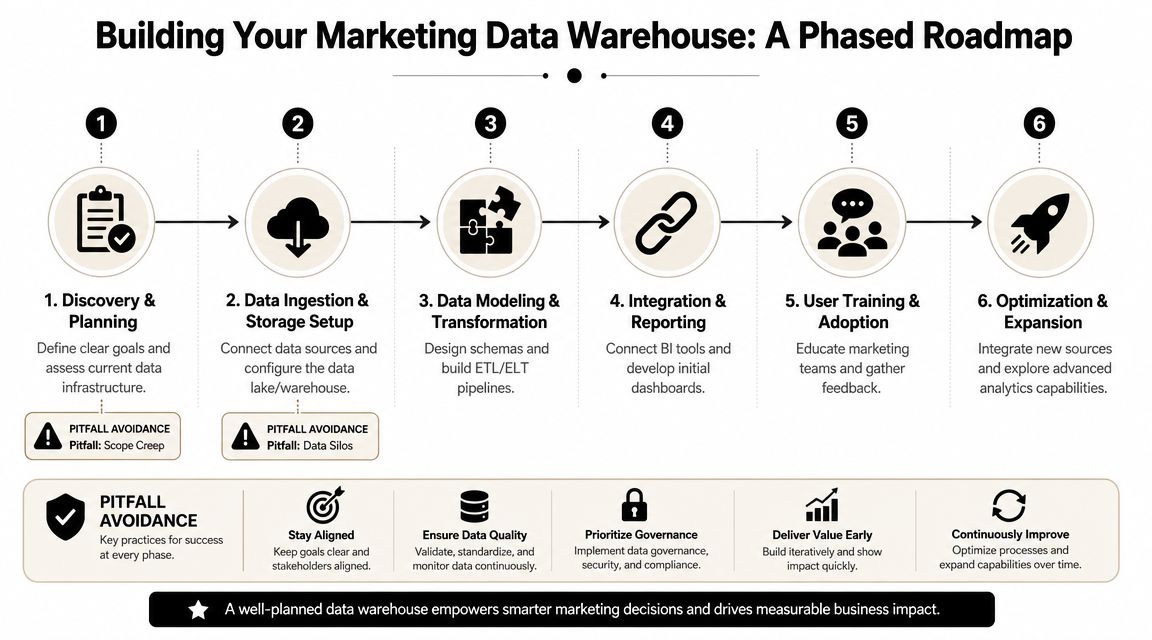
A common pitfall is trying to build the finished state on day one. The better path is phased. Start with a narrow decision problem, prove the model, then expand.
Modern warehouses also work better when the architecture is separated into layers such as source, staging, storage, and presentation. That separation improves reliability and performance by keeping ingestion, transformation, and BI workloads from competing for the same resources, as described in P3 Adaptive's data warehouse characteristics overview.
A phased rollout that works
A realistic rollout often moves through three motions.
Crawl starts with paid media and top-line conversion reporting. Pull ad spend, campaign metadata, and core website conversions into the warehouse. Clean naming conventions. Build one trusted spend-to-conversion dashboard. The goal here isn't sophistication. It's trust.
Walk adds web behavior, product signals, and better campaign grouping. Through these enhancements, teams usually start seeing the value of historical retention and cleaner dimensional models. You can compare acquisition trends over time and stop rebuilding reports every month.
Run brings in CRM and downstream revenue data. Now the warehouse starts supporting pipeline analysis, funnel conversion by segment, account reporting, and reverse ETL use cases. This phase often exposes a talent gap, which is why some teams use specialist support or external hiring options such as AI engineer placement when they need implementation capacity without building a full internal data engineering bench immediately.
A simple project checklist helps:
Start with one business question
“What is blended acquisition cost?” is better than “Unify all company data.”Choose the minimum viable sources
Usually ad platforms, analytics, and CRM before anything else.Lock naming rules early
Campaign taxonomy drift will wreck downstream reporting faster than most API issues.Publish definitions
A metric dictionary prevents endless re-litigation of basic numbers.
Mistakes that slow teams down
The most common pitfall is starting from tools instead of questions. Teams compare Snowflake versus BigQuery, or dbt versus native SQL, before they've agreed on the decisions the warehouse needs to support.
Another one is underestimating data modeling. Raw ingestion looks impressive in a demo. It's much less impressive when every analyst writes a different version of “qualified pipeline by source.”
Watch for these failure modes:
| Pitfall | What it looks like | Better approach |
|---|---|---|
| Scope creep | Every department adds requests before core reporting works | Ship one trusted use case first |
| No ownership | Marketing, data, and rev ops each assume someone else governs definitions | Assign metric and model owners |
| Skipping governance | Campaign names, lifecycle stages, and IDs drift constantly | Standardize dimensions and validation rules |
| Dashboard-first thinking | Teams polish charts before fixing data grain and joins | Model first, visualize second |
A warehouse project usually fails quietly. Not because the tech breaks, but because nobody agrees on what the numbers mean.
The healthiest implementations are boring in the best way. Stable pipelines. Clear dimensions. Fewer debates. Faster answers.
Choosing Your Tech Stack and Data Enrichment Partners
Once the operating model is clear, the stack decision gets easier. You're not picking “the best tools.” You're picking tools that fit your data volume, team skills, reporting cadence, and tolerance for maintenance.
How to evaluate each layer
The modern stack usually includes five working categories.
| Category | What it does | Common options |
|---|---|---|
| Warehouse | Stores analytical data centrally | Snowflake, BigQuery, Redshift |
| Ingestion | Pulls data from source systems | Fivetran, Airbyte, Stitch |
| Transformation | Applies modeling and business logic | dbt, SQL-based workflows |
| BI | Serves dashboards and reporting | Looker, Tableau, Power BI |
| Activation | Sends modeled outputs back to business tools | Hightouch, Census |
When comparing warehouses, don't just ask about query speed. Ask how pricing behaves under your likely usage pattern. Some teams are storage-heavy. Others are dashboard-heavy with lots of repeated queries. The cheapest-looking platform can become the wrong one if your reporting behavior doesn't fit its cost model.
For ingestion, reliability often matters more than breadth alone. A connector that breaks every time a platform changes an API will create more operational drag than a smaller connector library that's better maintained.
For transformation, dbt has become a practical standard because it helps teams version logic, document models, and keep SQL maintainable. But a tool won't save a bad model. If your business definitions are fuzzy, they'll stay fuzzy in prettier code.
Where enrichment fits in the stack
Enrichment isn't a side add-on. In many B2B setups, it's part of the data quality layer.
If your warehouse stores leads and accounts with incomplete firmographic or contact data, segmentation gets weak fast. Routing suffers. Scoring gets noisy. Reporting by ICP, company size, role, or market segment becomes less trustworthy.
That's why teams often pair their warehouse with enrichment tools. If you're evaluating vendors in that category, this roundup of B2B data enrichment tools is a useful place to compare the field. One option in this layer is Icypeas, which focuses on B2B contact and company enrichment, including email discovery, verification, reverse email lookup, and CRM enrichment workflows.
A practical buying lens for enrichment looks like this:
Coverage fit
Does the vendor match the geographies, industries, and roles you target?Workflow fit
Can the data be used in batch enrichment, API-based product flows, or CRM cleanup?Governance fit
Can your team control what gets appended, when, and into which systems?Measurement fit
Will the added fields materially improve segmentation, routing, attribution, or account analysis?
The strongest warehouse stack is the one your team can run consistently. Not the one with the longest architecture diagram.
If your team is building a marketing data warehouse and needs cleaner company and contact records inside that stack, Icypeas can fit as the enrichment layer. It helps sales, marketing, and rev ops teams enrich B2B records, verify emails, and improve CRM data quality so warehouse models, segmentation, and activation workflows run on more complete inputs.


.png)


.webp)