.avif)
What Is Volume of Sales? a B2B Guide to a Key Metric


.avif)
Revenue is up. The board is satisfied. Your reps are exhausted.
That combination usually means the surface metrics are hiding something. Maybe the team closed more deals, but they came from smaller accounts. Maybe pipeline stayed busy, but conversion slipped. Maybe outbound activity increased, yet too many opportunities entered the funnel with weak fit and never moved cleanly to close.
That's where volume of sales stops being a textbook metric and becomes an operating signal. In practice, it tells you whether growth comes from genuine demand, broader market reach, better qualification, stronger conversion, or more effort applied to weaker opportunities. If you run RevOps or lead a B2B sales team, that distinction matters more than the headline number.
At the macro level, the same logic drives major planning decisions. In U.S. retail, the Census Bureau estimated April 2026 sales at $757.1 billion, up 0.5% from March 2026 and up 4.9% from April 2025, which shows why sales volume is treated as a real-time demand indicator in forecasting and analysis according to the U.S. Census retail sales release. If a half-point monthly move matters at market scale, it also matters inside a sales org trying to understand whether pipeline is strengthening or just getting noisier.
In B2B, the mistake is treating volume as a vanity KPI. The better approach is to read it like a system diagnostic. Strong volume with weak progression tells one story. Flat volume with improving close quality tells another. The teams that scale profitably know the difference.
Table of Contents
- Introduction Is Your Sales Volume Telling the Whole Story
- Two ways teams use the term
- Unit Volume vs. Monetary Volume at a Glance
- Why constant-price thinking matters
- Start with better market coverage
- Fix data quality before adding activity
- Look for overlooked pockets of demand
Introduction Is Your Sales Volume Telling the Whole Story
A familiar sales review goes like this. The CRO asks why the team needed more meetings to land roughly the same amount of business. Sales says leads were weaker. Marketing says lead count was fine. Finance sees revenue moving and assumes the engine is healthy.
But volume reports often explain the tension better than revenue reports do.
If the team is booking more meetings but fewer of them convert, your problem isn't effort. If reps are closing a similar number of deals but average account quality is falling, your problem isn't top-of-funnel quantity alone. And if opportunity count looks stable while cycle time stretches, the bottleneck is probably later in the process than people think.
Sales volume becomes useful when you stop asking “is it up?” and start asking “what had to happen in the funnel for this number to exist?”
That's why experienced operators don't read volume of sales as a single scoreboard metric. They read it as a pattern. It reveals whether the organization is creating enough opportunities, whether those opportunities are shaped by the right channels, and whether the team can turn raw activity into revenue without burning margin or capacity.
In day-to-day B2B work, that means pairing volume with context. Which segment produced it. Which source fed it. Which reps handled it well. Which products convert cleanly. Which motions create motion but not outcomes.
A lot of reporting misses that nuance. It celebrates more deals or more units without asking whether those deals are durable, profitable, or repeatable. That's how teams drift into the worst version of growth. Busy calendars, crowded dashboards, and weak pipeline quality.
What Is Sales Volume Units vs Monetary Value
Sales volume is easiest to understand when you strip away finance language. It answers a simple question. How much did you sell during a defined period?
In operational terms, the most precise meaning is unit-based. Sales volume is the count of units sold over a reporting window, often broken out by product, region, or channel, as explained in Zendesk's overview of sales volume as a unit-based sales metric. In B2B, those “units” might be seats, subscriptions, contracts, service packages, or transactions, depending on the model.
Two ways teams use the term
Teams generally use the phrase in one of two ways.
Unit volume tracks quantity.
A coffee shop example makes this simple. If it sold 300 cups today, the unit volume is 300. In B2B SaaS, the equivalent might be contracts signed, licenses activated, or orders processed.
Monetary volume tracks the cash value associated with those sales.
If the same coffee shop brought in $1,500, that's monetary volume. In your world, it's booked revenue, contracted value, or another money-based output.
Both matter. They answer different questions.
- Unit volume helps with throughput: It shows whether demand and production are moving.
- Monetary volume helps with value capture: It shows whether the company is generating enough economic output from that activity.
- The gap between the two reveals pricing and mix: If units rise while monetary results lag, you may be discounting, selling down-market, or shifting toward lower-value offers.
Unit Volume vs. Monetary Volume at a Glance
| Aspect | Unit Sales Volume | Monetary Sales Volume (Revenue) |
|---|---|---|
| What it measures | Number of units sold | Value generated from sales |
| Best use | Demand tracking, capacity planning, throughput analysis | Revenue planning, pricing analysis, financial reporting |
| Common B2B examples | Contracts, orders, seats, subscriptions | ARR, booked revenue, contract value |
| Main risk if used alone | Ignores account quality and margin | Can hide whether growth came from price, discounting, or mix shifts |
Why constant-price thinking matters
There's another nuance that matters when markets get messy. Revenue can go up without real expansion.
Eurostat defines the volume of sales index as a measure of changes in enterprise sales revenues in constant prices with the reference period set to the calendar month, according to its metadata on the volume of sales index in constant prices. That matters because it separates real business activity from nominal changes driven by price increases.
For B2B teams, the lesson is practical even if you never build a formal price-adjusted index. Don't assume more revenue always means more selling power. Sometimes the team sold more. Sometimes pricing changed. Sometimes product mix changed. Sometimes large renewals masked new-logo weakness.
Practical rule: Track units and money side by side. If they move together, your story is usually cleaner. If they diverge, investigate before celebrating.
Why Sales Volume Is a Critical B2B Metric
Sales leaders usually say they care about pipeline health, but many still manage by outcomes alone. Revenue, attainment, and close rate are important. They're also lagging signals. By the time they move, the underlying issue has often been in the system for weeks or months.
Volume gives you an earlier read.
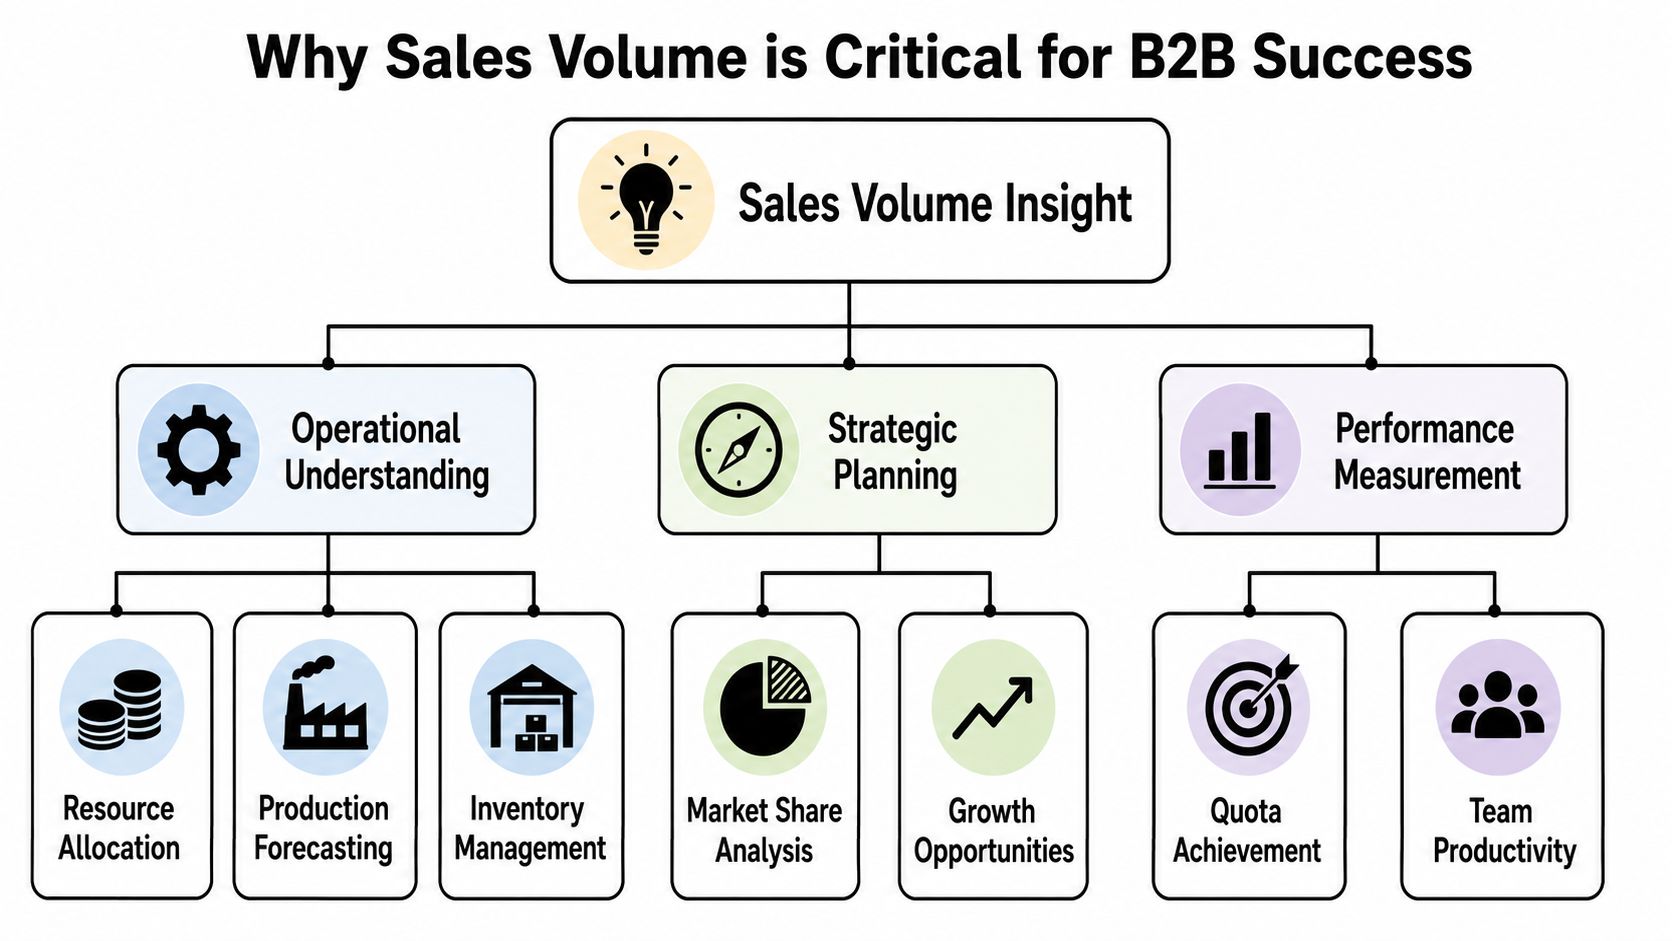
Volume shows whether the engine is healthy
Advanced teams use volume as a diagnostic for pipeline efficiency. Tracking lead volume by source, conversion rate, average deal size, sales cycle length, and pipeline coverage helps separate growth driven by more opportunities from growth driven by better economics, as described in NetSuite's guide to sales metrics for pipeline efficiency. The useful part isn't the metric itself. It's the contrast between metrics.
A few patterns show up repeatedly:
- High lead volume with weak conversion: Qualification is probably loose, targeting is off, or one channel is flooding the funnel with low-fit accounts.
- Stable top-of-funnel volume with longer cycle time: Reps may be getting meetings, but deals are stalling in evaluation, procurement, or stakeholder alignment.
- Rising opportunity volume with flat revenue: Deal count is increasing, but average account value or win quality may be deteriorating.
- Lower volume with better progression: Targeting may be tighter, and the team may be improving even if raw activity is down.
That's why volume belongs in operating reviews, not just monthly scorecards. It tells you where to inspect.
What good operators look for
The strongest RevOps teams don't ask whether pipeline is “full.” They ask whether it's productive.
A productive pipeline has enough inbound and outbound volume entering the system, but it also has sensible progression between stages. Reps aren't compensated for hauling bad-fit accounts into discovery forever. Managers don't confuse booked meetings with qualified opportunities. Marketing doesn't defend lead count when channel quality has slipped.
Here's what works better than raw-count reporting:
Read volume by stage, not just by total
New leads, qualified opportunities, proposals, and closed deals each tell a different story.Tie source to outcome
A channel that fills the top of the funnel but clogs the middle is expensive, even if it looks productive on the dashboard.Watch time-in-stage alongside count
Throughput matters. Slow movement can suppress future revenue long before the quarter ends.Use volume to guide staffing decisions
If rep capacity is tight in one segment and underused in another, volume analysis will usually show it before morale does.
Healthy sales volume doesn't mean “more of everything.” It means enough of the right opportunities are moving at the right pace.
How to Track and Report Sales Volume Effectively
The hardest part of volume reporting isn't building a dashboard. It's making sure the underlying records are consistent enough to trust. Most CRM setups fail here first. Stages are loosely defined, products are inconsistently tagged, and source fields are either overwritten or left blank.
That creates fake precision. The report looks polished, but operators can't act on it.

Build the reporting layer first
In Salesforce, HubSpot, or a warehouse-based reporting stack, start with a small set of required fields that every opportunity and lead record must carry cleanly.
Use a reporting model that includes:
- Clear source tracking: Keep original lead source separate from the latest campaign touch so attribution doesn't collapse into recency bias.
- Segment fields that matter: Company size, region, product line, and motion type are usually enough to start.
- A stable definition of unit: Decide what counts as a unit in your business. It could be orders, contracts, seats, or closed deals.
- Stage timestamps: Without date history, you can't analyze throughput or stage aging.
Teams that are still building the basics often benefit from reviewing how a consistent client acquisition system structures pipeline stages and handoffs. Not because one framework fits every business, but because disciplined stage definitions make volume analysis usable.
What a useful dashboard actually includes
Most dashboards have too many charts and not enough decisions built into them. A good sales volume dashboard should answer three questions quickly. What entered the funnel. What moved. What converted.
A practical setup usually includes widgets like these:
| Dashboard widget | What it helps you spot |
|---|---|
| Unit sales by rep this quarter | Rep throughput and coaching needs |
| Monetary volume by product line month over month | Mix changes and revenue concentration |
| Lead volume by source vs conversion rate | Channel quality, not just channel quantity |
| Opportunities created by segment | Whether target markets are actually being covered |
| Time in stage by segment or owner | Bottlenecks and approval friction |
One useful discipline is to pair every volume chart with a quality chart. If you track lead count by source, place conversion beside it. If you track deals won by segment, place retention or expansion beside it in a separate operating view.
For teams cleaning up unreliable records, this is also where data analysis work matters. A practical reference on marketing data analysis is useful because reporting quality depends on field consistency, join logic, and how well your data model reflects the actual buying journey.
If a dashboard can't tell a frontline manager what action to take on Monday morning, it's reporting theater.
Common Pitfalls and How to Segment Your Analysis
The biggest mistake teams make with volume of sales is assuming more is automatically better. It isn't. More low-fit opportunities can dilute rep focus, increase cycle friction, and create flattering top-of-funnel numbers that never translate into efficient revenue.
That problem gets worse when leadership rewards counts without checking account quality.
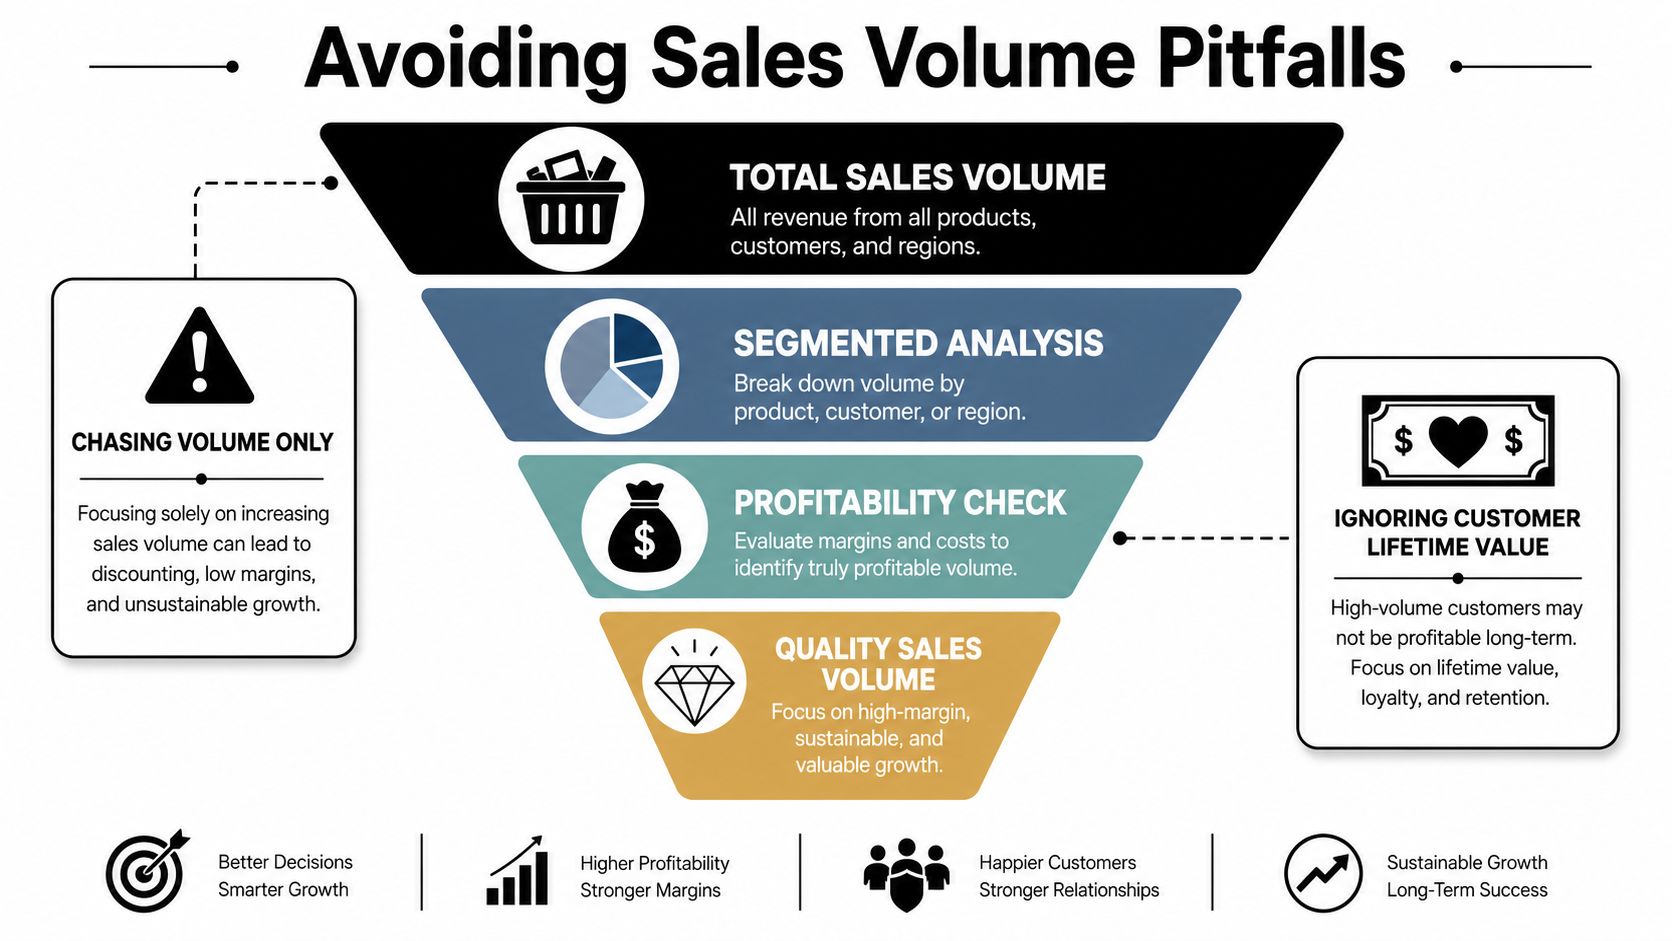
More volume can still mean worse economics
A critical point that many teams miss is that sales volume is not the same as sales quality. As discussed in Recon Insight's article on why sales volume must be separated from sales quality, volume can rise while profitability falls, especially when go-to-market economics differ by segment and those differences are ignored.
That happens in real operating environments all the time.
You add an outbound motion targeting smaller accounts because the list is easier to build. Meeting count jumps. Opportunity count follows. But those customers need more support, buy fewer products, negotiate harder, or churn faster. On paper, volume is up. In reality, the business just bought itself extra work.
Three other pitfalls show up often:
- Ignoring seasonality: Teams compare one period to another without checking whether buying behavior or contract timing naturally shifts.
- Mixing motions together: Inbound, partner, outbound, and expansion each have different economics. Combining them hides what's working.
- Using dirty enrichment and source data: If firmographics, ownership, or channel data are wrong, your segmentation logic will point the team in the wrong direction.
Segmentation turns noise into decisions
The fix is simple in concept and harder in execution. Slice volume before you judge it.
A useful segmentation model usually starts with four cuts:
Customer segment
Compare SMB, mid-market, and enterprise separately. The same level of volume can mean very different effort and margin across those groups.Lead source
Break out paid, organic, outbound, partner, referral, and event-driven pipeline. You want to know where productive volume originates.Geography or territory
Regional variation often explains why one team looks more efficient than another. Territory design can distort rep comparisons.Product line or use case
Some offers generate quick wins but weak long-term account value. Others move slower but create better expansion potential.
A lot of teams stop there. They shouldn't. The next level is customer fit and data quality. If segmentation is built on weak records, your analysis will be directionally wrong. That's why disciplined marketing data enrichment matters operationally, not just administratively. Better enrichment improves the quality of your segment definitions, which improves the decisions built on them.
The right question isn't “where is volume highest?” It's “which segments create volume that converts cleanly and holds its value?”
Actionable Tactics to Increase Your Sales Volume
If your goal is to increase volume of sales, the instinct is usually to push harder on activity. More calls. More sequences. More campaigns. Sometimes that helps. Often it just amplifies the weaknesses already in the system.
The cleaner way to grow volume is to improve the inputs first, then increase activity against better targets.
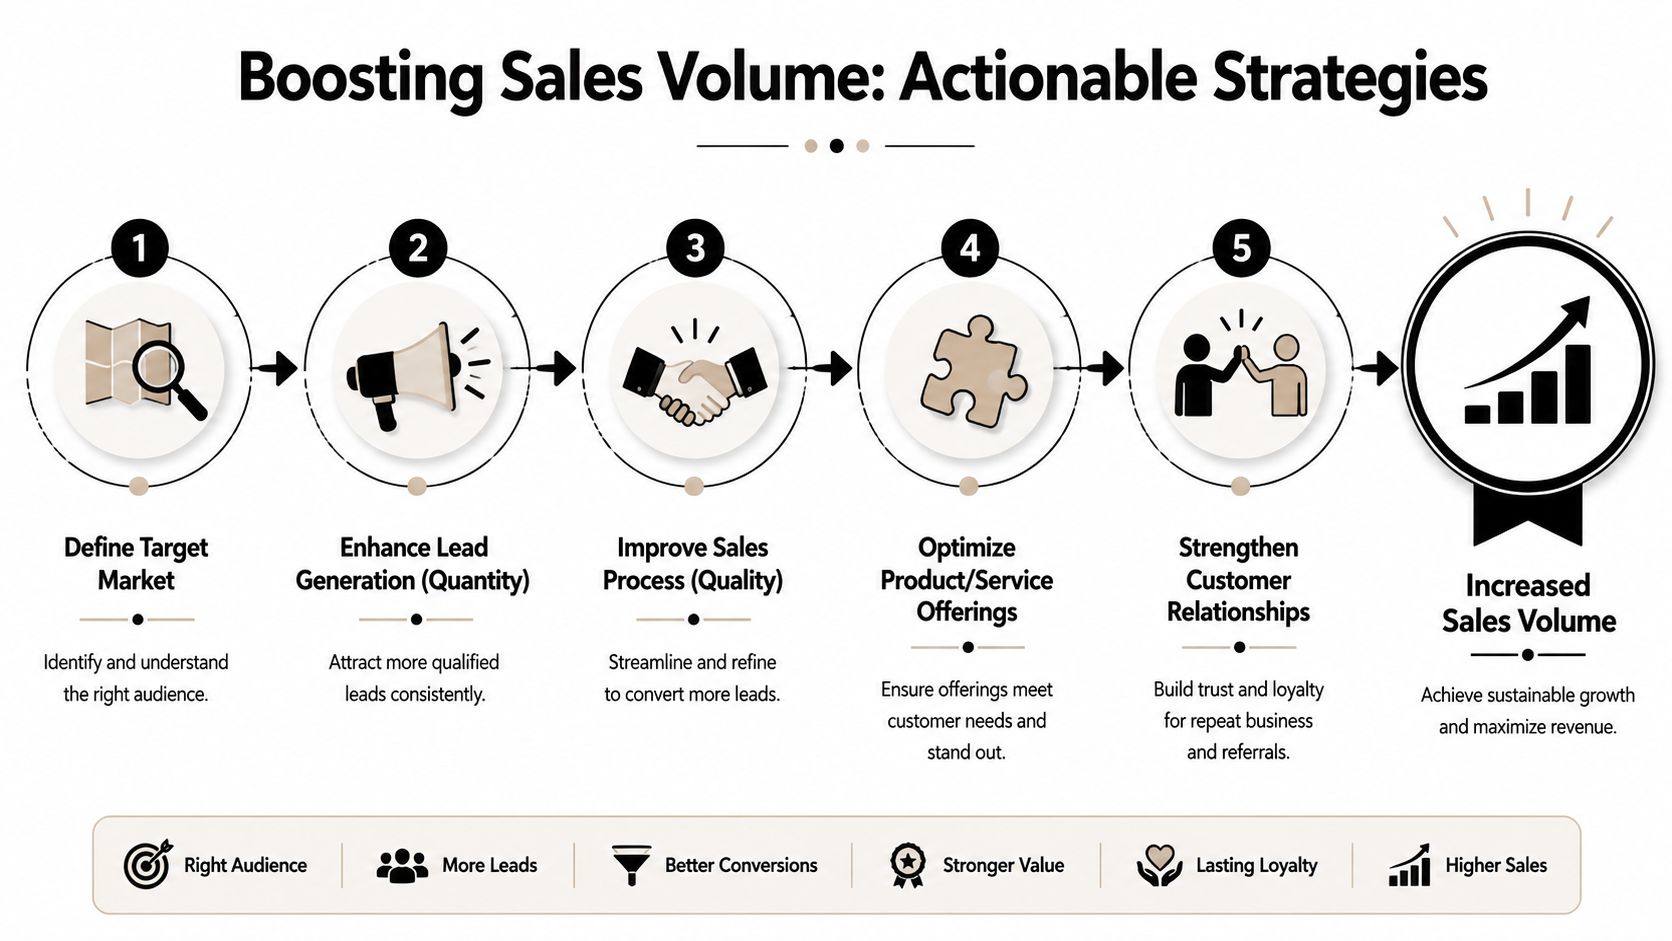
Start with better market coverage
Many teams say they've “worked the market” when they've merely worked the easiest slice of it. The result is predictable. Reps keep calling familiar accounts while viable whitespace goes untouched.
A stronger approach looks like this:
- Refresh your ideal customer profile: Tighten it around fit signals that correlate with clean progression.
- Expand the addressable account set: Add adjacent segments, lookalike companies, and under-covered territories.
- Separate reachable from irrelevant: A larger list isn't helpful if contactability and buying relevance are weak.
Tools matter, but only if they support a defined motion. A platform such as Icypeas can help teams find, verify, and enrich professional contact data so outreach is built on actual reachable accounts rather than partial records and guessed emails.
Fix data quality before adding activity
Bad data creates fake effort. SDRs work records with missing titles, stale emails, weak firmographics, and duplicate accounts. Managers then read the output as a rep productivity issue when it's really an input quality issue.
Better habits are usually operational, not glamorous:
- Verify contactability before launch: Don't let campaigns start with uncertain email quality.
- Standardize account ownership rules: Volume suffers when reps avoid messy records or work against each other.
- Enrich fields that affect routing: Industry, employee band, geography, and role are often enough to improve both targeting and handoff logic.
- Review bounce and reply patterns qualitatively: Low response isn't always messaging. Sometimes the list is entirely wrong.
A good technical foundation also helps teams make sense of outreach performance over time. If you want a deeper view into how models and structured data improve go-to-market decisions, this guide to marketing data science is worth reading.
A short walkthrough can help frame the execution side:
Look for overlooked pockets of demand
One of the most underused ways to increase sales volume is to stop chasing broad averages and start finding micro-markets. Existing guidance on underserved-market identification emphasizes combining mapping, demographic, and purchase-pattern data to reveal overlooked pockets of demand, as outlined in this article on finding underserved markets with sales territory mapping.
In practice, that means looking for places where your current coverage model is too coarse.
You might find:
- Industry niches that match your product well but rarely appear in current outbound lists
- Regional clusters where account density supports focused rep coverage
- Cross-purchase patterns that suggest a product can be sold into segments the team hasn't prioritized
- Small but reachable categories that are unattractive in aggregate reporting but productive when worked intentionally
Profitable sales volume comes not just from more names, but from better names, cleaner records, tighter segmentation, and clearer route-to-market choices.
Conclusion From Metric to Momentum
Volume of sales matters because it tells you more than how much the team sold. It tells you how the engine is behaving.
When you track it as units and value, report it with stage and source context, and segment it by account quality, it stops being a vanity metric. It becomes a diagnostic layer for pipeline health. You can see whether growth is coming from real demand, better conversion, improved targeting, or from brute-force activity that won't hold up.
That shift changes how teams operate. Managers coach with better evidence. RevOps can spot bottlenecks sooner. Sales leaders can separate productive volume from expensive noise. And when pricing enters the picture, broader commercial decisions such as B2B pricing strategies become easier to evaluate because you're no longer treating all volume as equal.
The practical takeaway is simple. Better sales outcomes usually start upstream. Clean data, disciplined segmentation, and honest pipeline analysis create more predictable volume. Predictable volume creates momentum.
If you want to improve sales volume without flooding the funnel with bad-fit accounts, take a look at Icypeas. It helps B2B teams find, verify, and enrich professional contact data so outreach, routing, and reporting start from a cleaner foundation.


.png)


.webp)