.avif)
Marketing Data Analysis: A Guide for Growth Teams

.avif)
You're probably dealing with some version of this right now. Paid search reports one story, CRM dashboards tell another, web analytics shows rising traffic, and leadership still asks the same question: what is marketing contributing to pipeline and revenue?
That gap has widened as attribution got messier. Teams now run campaigns across email, paid media, communities, partner channels, webinars, outbound, and organic search, while privacy changes and weaker identity resolution make neat channel-by-channel reporting less trustworthy. Matomo describes the current environment as “channel fragmentation, evolving KPIs and data constraints,” and that's exactly why surface metrics alone no longer hold up in planning or budget reviews, as noted in its discussion of advanced marketing analytics.
For B2B teams, the answer isn't another dashboard. It's better marketing data analysis grounded in clean, connected, first-party data, then strengthened with enrichment so records are usable at the account, contact, and funnel level. If you're trying to move beyond vanity reporting, these actionable SEO insights are also useful because they reinforce a broader point: visibility alone doesn't create decisions. Structured, trustworthy data does.
Table of Contents
- From Data Chaos to Marketing Clarity
- It started when intuition stopped being enough
- The four levels that matter in practice
- Start with the CRM you already have
- Build segments around buying reality
- Use performance feedback to refine the model
From Data Chaos to Marketing Clarity
Most marketing teams aren't short on data. They're short on agreement.
One dashboard says campaigns are healthy because clicks are up. Another says lead volume is soft. Sales says lead quality slipped. Finance wants a cleaner explanation for spend. Nobody is technically wrong, but nobody is looking at the same system of truth either.
That's where marketing data analysis matters. It isn't a reporting chore for analysts sitting downstream from the business. It's the discipline that turns scattered events, channel signals, and CRM records into decisions a growth team can defend. Done well, it helps you answer three questions that show up in every serious review:
- What changed
- Why it changed
- What to do next
The biggest mistake I see is treating analysis as a layer on top of messy systems. It doesn't work. If campaign naming is inconsistent, lead records are incomplete, and touchpoints live in disconnected tools, the charts may still look polished, but the conclusions will be shaky.
Practical rule: If your team can't reconcile campaign data to accounts, contacts, and funnel stages, you don't have a measurement problem. You have a data foundation problem.
Modern teams need a different stance. Instead of asking one tool to explain the whole customer journey, they need to combine behavioral data with first-party records and enrichment that fills the gaps web metrics can't see. That approach won't make attribution perfect. It will make decisions more credible, which is usually what the business needs.
What Is Marketing Data Analysis
Marketing data analysis became a formal discipline because marketers needed statistically reliable ways to measure impressions, conversion rate, click-through rate, engagement, profitability, recurring revenue, and lead volume instead of relying on intuition alone. Adobe notes that modern practice uses approaches such as time series analysis and regression analysis to uncover trends and relationships, shifting marketing from descriptive reporting into a predictive decision system in its overview of marketing analytics.
It started when intuition stopped being enough
A lot of teams still confuse analysis with reporting. Reporting tells you what happened. Analysis helps you decide what that means and whether to change budget, targeting, messaging, or process.
It serves as a business health check.
A dashboard that shows MQL volume, pipeline created, and campaign responses is the equivalent of basic vitals. Useful, but incomplete. Real analysis asks whether the signal is stable, whether a recent change explains the movement, whether seasonality is masking the result, and whether the pattern is likely to continue.
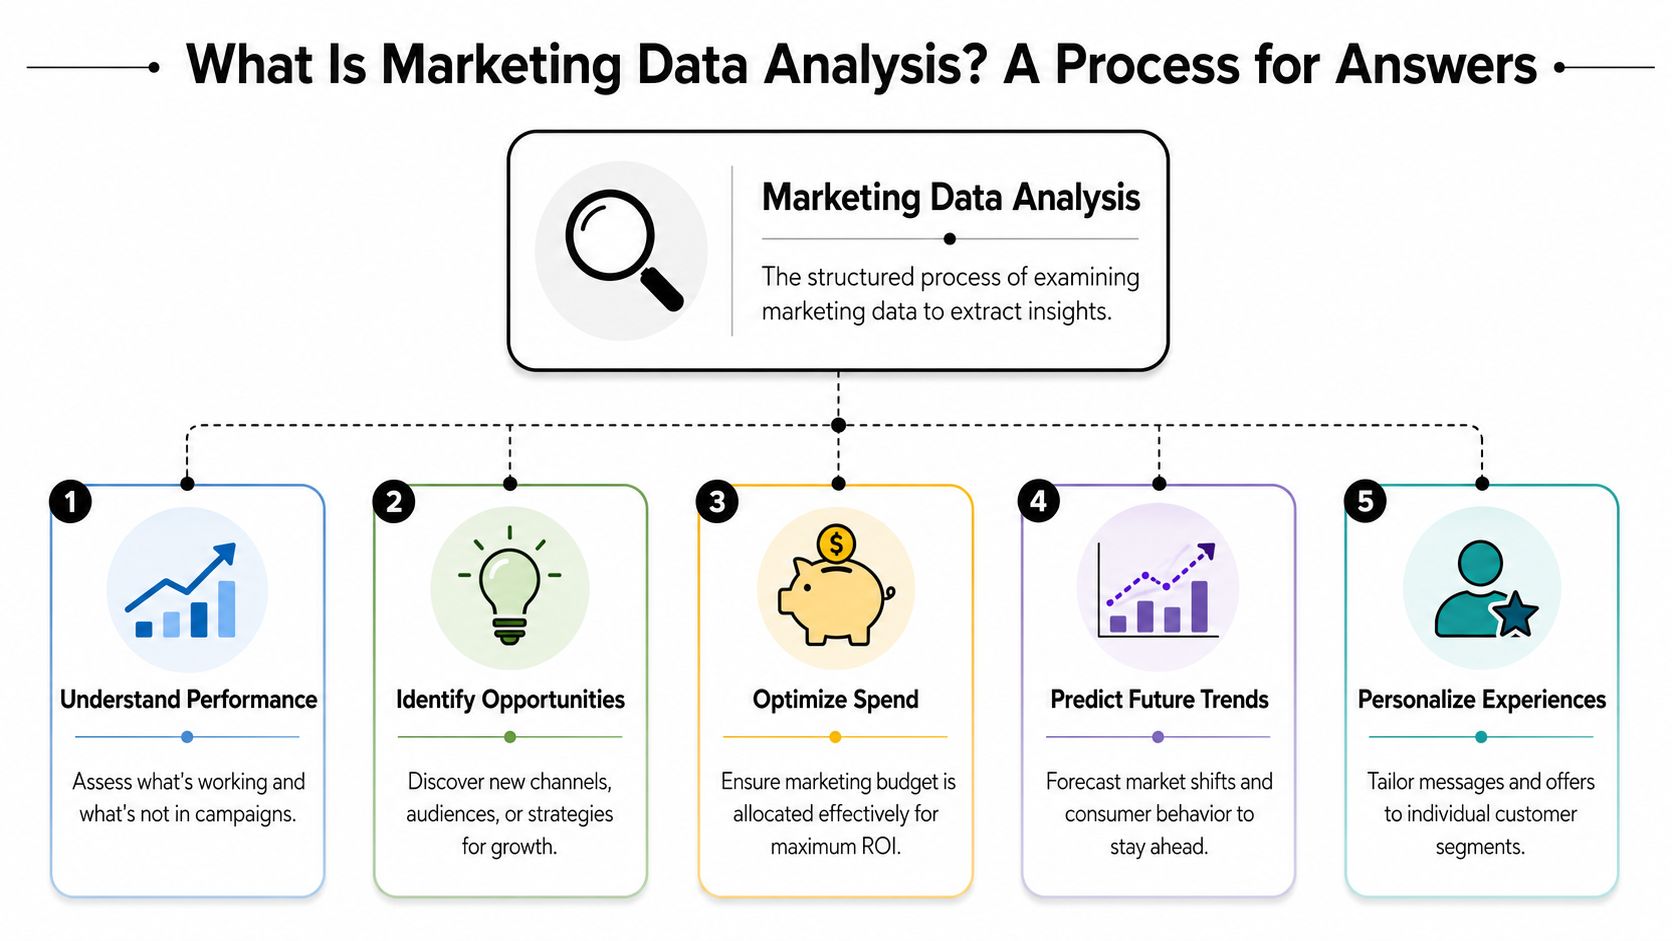
Three things usually separate mature teams from noisy ones:
- They clean data before modeling it. Duplicate contacts, broken campaign names, and missing lifecycle stages can distort basic conversion reporting.
- They compare the right time windows. Weekly movement can be useful operationally, but trend decisions usually need monthly or longer views.
- They tie metrics to a business question. A chart without a decision attached is mostly decoration.
The four levels that matter in practice
The easiest way to explain marketing data analysis to a non-analyst is through four levels of maturity.
| Level | Core question | What it looks like in marketing |
|---|---|---|
| Descriptive | What happened? | Lead volume changed, paid search spend increased, demo requests fell |
| Diagnostic | Why did it happen? | A landing page change reduced conversion, one region underperformed, lead routing delayed follow-up |
| Predictive | What will likely happen next? | Forecasting pipeline creation from historical patterns and current volume |
| Prescriptive | What should we do? | Reallocate spend, tighten segmentation, fix handoff rules, change creative |
Descriptive analytics is where organizations often operate. They have dashboards, weekly reports, and channel summaries.
Diagnostic analytics is the stage at which marketing starts becoming operationally useful. At this stage, you isolate why paid social drove engagement but not qualified meetings, or why a webinar generated form fills but weak downstream progression.
Predictive analytics uses historical patterns to estimate likely outcomes. That might mean forecasting expected pipeline by source or using regression to test whether spend changes and conversion movement are related.
Prescriptive analytics is the hardest tier. It moves from insight to action. Not just “partner campaigns underperformed,” but “reduce spend in this segment, shift effort to the region with stronger sales acceptance, and simplify the offer for smaller accounts.”
Marketing data analysis is most valuable when it changes decisions, not when it adds slides.
In practice, strong B2B teams don't need every model under the sun. They need enough analytical depth to steer budget, improve targeting, and spot false positives before they scale them.
The Core Metrics and KPIs to Measure
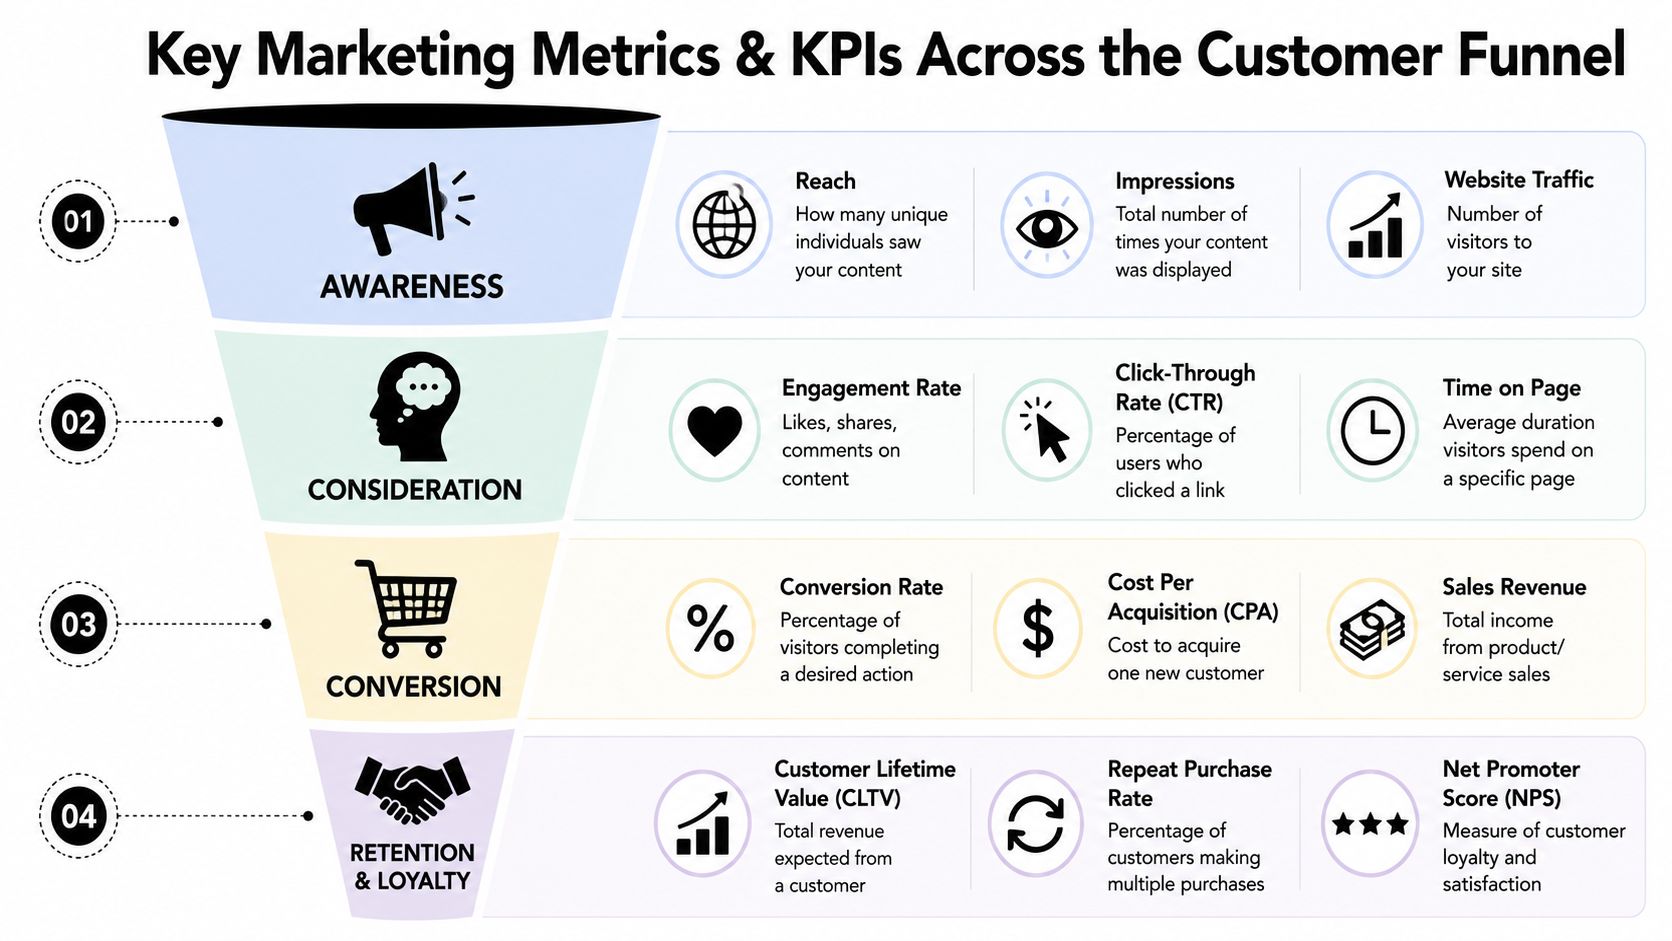
The cleanest way to choose marketing KPIs is to map them to the funnel. Serpstat notes that modern marketing analysis has moved from broad audience measurement to granular funnel analytics, with core KPIs such as conversion rate, CAC, churn, and LTV tied to awareness, consideration, conversion, and retention stages in its guide to marketing metrics.
A funnel view keeps metrics useful
If you measure everything at once, you'll end up prioritizing whatever moved most recently. That's rarely the same thing as what matters most.
A funnel view forces discipline.
At the top, you're asking whether the market is seeing you. In the middle, whether buyers are engaging. Near the bottom, whether demand is turning into pipeline and customers. After purchase, whether the value holds.
Use this visual as a simple reference model:
The trap is measuring one stage and assuming it explains the rest. Strong awareness with weak conversion doesn't mean the campaign worked. Strong conversion with weak retention doesn't mean acquisition is efficient. Funnel metrics need to be read together.
Which KPIs answer which business questions
For most B2B teams, these are the metrics that deserve regular attention:
Awareness metrics
Reach, impressions, and website traffic help answer whether campaigns are expanding visibility with the right audiences. These are useful early indicators, but they're weak proxies for commercial impact on their own.Consideration metrics
Click-through rate and engagement rate help answer whether messaging is relevant enough to earn attention. If traffic rises while engagement weakens, the issue is often targeting quality or message fit, not volume.
A short explainer can help align teams on funnel thinking before KPI reviews:
Conversion metrics
Conversion rate and customer acquisition cost tell you whether attention is turning into business outcomes efficiently. This is where many teams first discover that a “good” channel is only good at producing low-intent form fills.Retention metrics
Churn and lifetime value tell you whether acquisition quality holds after the handoff. If a channel brings in customers who don't expand or don't stay, the acquisition story is incomplete.
A metric becomes useful when the team agrees what action it should trigger.
For SaaS operators, it also helps to compare your internal definitions against a sharper list of essential SaaS marketing metrics, especially when marketing and finance use different language for acquisition efficiency and downstream value.
A few operating rules keep KPI reviews honest:
- Pair efficiency with quality. Don't look at CAC without looking at conversion and retention.
- Compare segments, not just totals. Geography, device, audience, and funnel stage often explain more than channel rollups.
- Track trends over time. One strong week can hide a weakening month.
- Use common definitions. If marketing, sales, and rev ops define “qualified” differently, your dashboard will never settle arguments.
The point isn't to collect more KPIs. It's to choose the smallest set that reveals where revenue is won or lost.
Common Methods and Statistical Techniques
The methods behind marketing data analysis sound more intimidating than they are. Most of them are just structured ways to answer a practical question.
The mistake is starting with the method. Start with the decision.
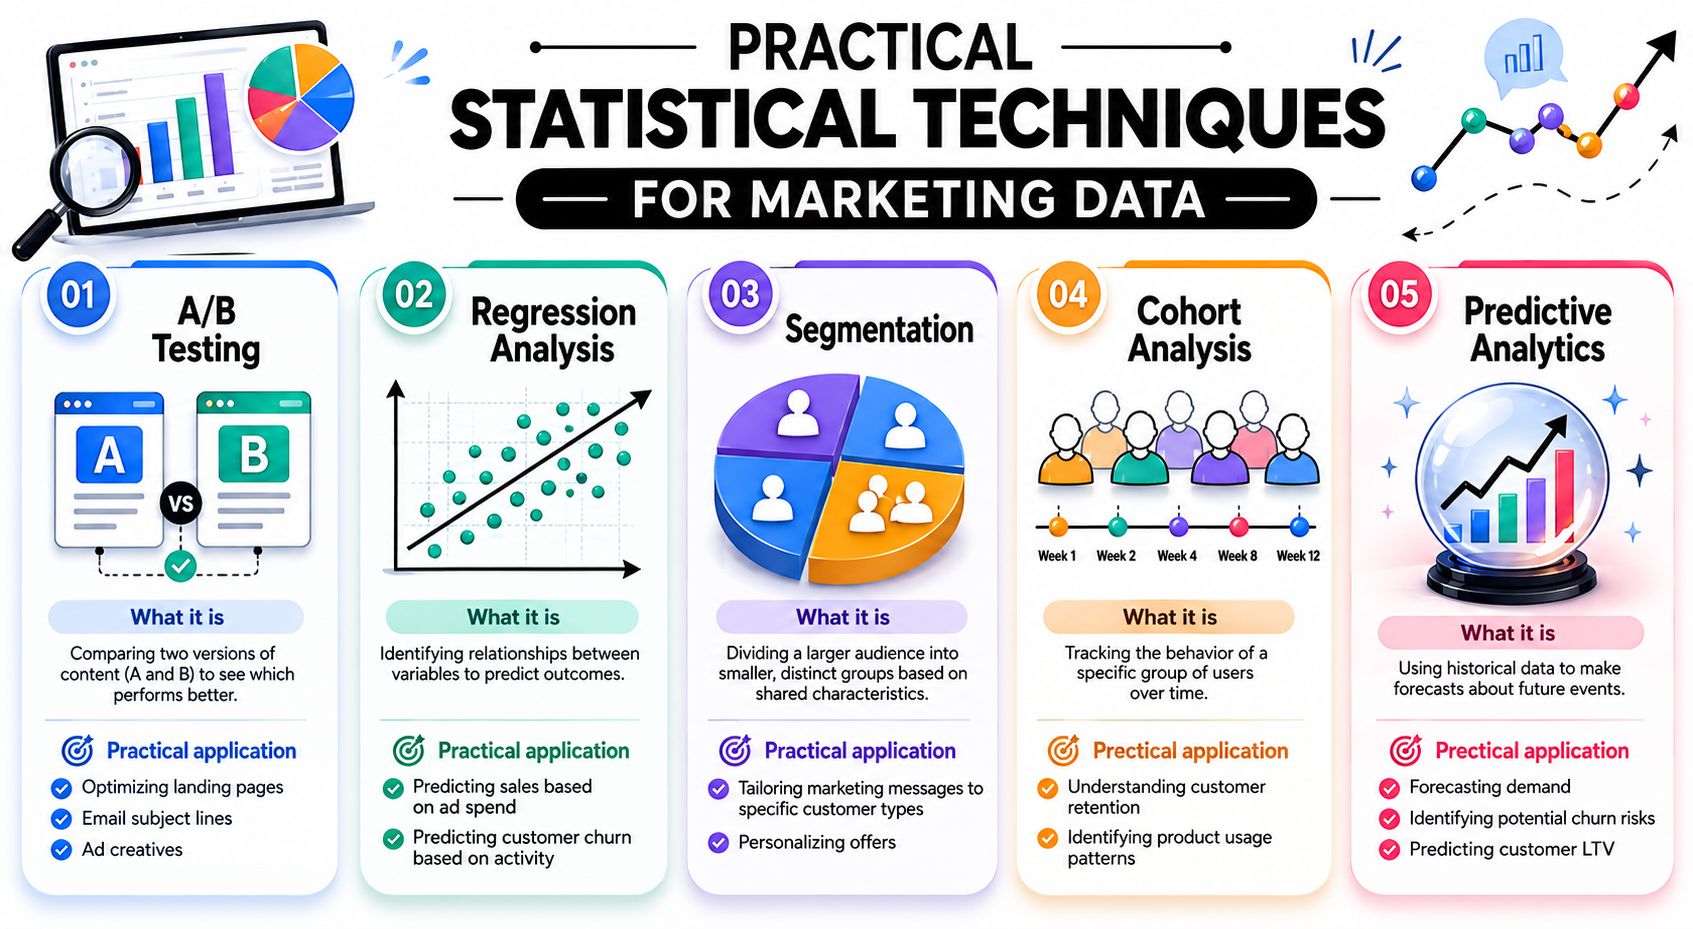
If you want to understand whether rising spend is associated with rising conversions, that's one kind of analysis. If you want to know whether users acquired in one period behave differently from users acquired in another, that's another. Statistical techniques are tools, not status symbols.
Use the simplest method that answers the question
Here are the methods most B2B teams can use without turning the marketing function into a research lab.
Regression analysis
Use regression when you want to understand the relationship between variables and estimate likely outcomes.
A practical example: you want to know whether changes in paid spend, branded search demand, and seasonality are associated with pipeline creation. Regression won't give perfect truth, but it can help separate correlation that looks real from movement that's mostly noise.
It's especially useful for forecasting. If your team has enough clean history, regression can support budget planning, lead volume estimates, or rough scenario modeling before the quarter starts.
Cohort analysis
Use cohort analysis when you care about how groups behave over time.
This is one of the best tools for B2B lifecycle questions. Compare leads acquired in one month with leads acquired in another. Compare customers acquired through webinars with customers acquired through outbound. Compare accounts touched by product-led onboarding with accounts that only received sales outreach.
Cohort analysis helps you avoid a common mistake: judging performance too early. Some campaigns look weak in the first window and strong later. Others create instant activity but poor downstream progression.
Segmentation and cluster analysis
Use segmentation when you already know the groups you care about. Use cluster analysis when you want the data to suggest natural groupings.
For day-to-day marketing ops, segmentation is more common. Segment by audience, geography, company type, or funnel stage. That's usually enough to spot performance differences that broad rollups hide.
Cluster analysis is helpful when behavior patterns don't line up neatly with your existing firmographic buckets. It can expose groups that respond similarly even when they don't share an obvious title, company size, or industry label.
Operator note: The best segment isn't the most detailed one. It's the one your team can actually target, route, message, and measure consistently.
Marketing mix modeling
Use marketing mix modeling when leadership needs a broader view of incremental impact across channels, especially when online and offline efforts overlap.
This method is powerful, but it is not forgiving. Improvado notes that MMM works best with a unified data foundation and at least 12 months of history, because without enough clean historical variation the model can confuse spend changes with seasonal trends and produce unstable recommendations, as explained in its overview of advanced marketing analytics techniques.
Where advanced models break down
Most failures in analysis aren't mathematical. They're operational.
Here's where teams get into trouble:
- They model dirty data. Missing values, duplicates, and inconsistent labels distort results before the analysis even begins.
- They overfit to what's easy to measure. Website activity is visible, but not every valuable buying signal happens on the site.
- They use advanced methods on weak history. Fancy attribution on shallow data often produces confident nonsense.
- They skip the business test. If a model recommends a budget shift that the team can't explain in plain English, it probably isn't ready.
Good analysis reduces uncertainty. It doesn't pretend to remove it.
Building Your Marketing Data Pipeline and Tool Stack
A reliable analysis program needs infrastructure. Not glamorous infrastructure. Functional infrastructure.
The easiest way to understand it is to think of a data factory. Raw materials come in from multiple sources. They get cleaned, standardized, joined, stored, analyzed, and then turned into something the business can act on.
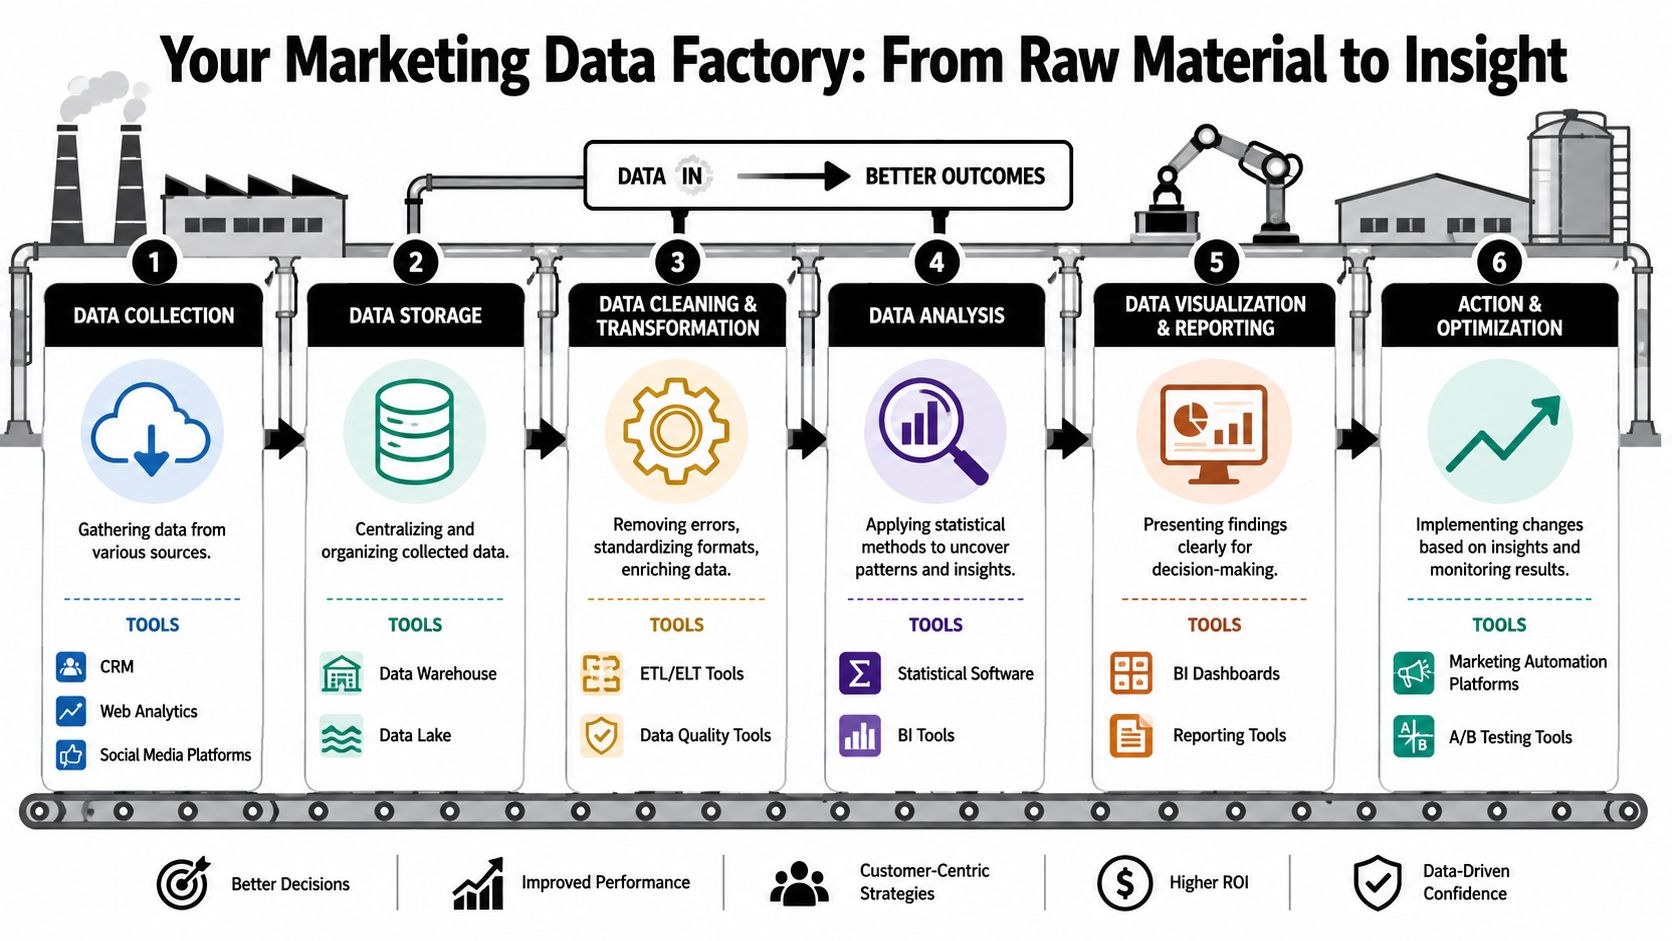
Think of it as a data factory
Most B2B teams pull from the same broad categories of source data:
| Layer | What lives there | Common examples |
|---|---|---|
| Source systems | Raw marketing and revenue activity | HubSpot, Salesforce, Google Analytics, LinkedIn Ads, Google Ads |
| Movement layer | Data extraction and syncing | Fivetran, Airbyte, native connectors |
| Transformation layer | Cleaning and modeling | dbt, SQL workflows, reverse ETL logic |
| Storage layer | Central warehouse | BigQuery, Snowflake, Redshift |
| BI layer | Dashboards and analysis | Looker, Tableau, Power BI |
Each layer has a job.
Source systems capture events, spend, responses, lifecycle changes, and revenue data. The movement layer pulls that data into a central environment. The transformation layer standardizes campaign names, resolves duplicates, aligns date formats, creates channel groupings, and joins contacts to accounts and opportunities. The storage layer keeps that unified record available. The BI layer exposes it to humans.
A lot of reporting pain comes from skipping the transformation layer and pushing raw connector output straight into dashboards.
Raw exports are not a data model. They're just unprocessed ingredients.
What a practical stack looks like
Many teams don't need a huge stack. They need a coherent one.
A practical setup usually includes:
A CRM as system of record
Salesforce and HubSpot are common anchors because they hold lifecycle, ownership, and commercial outcome data.A warehouse for unification
BigQuery or Snowflake often becomes the place where marketing, product, and revenue data finally live together.A transformation workflow
dbt or disciplined SQL modeling is what turns “campaign_name_final_v2” chaos into standard taxonomy.A BI layer for consumption
Looker, Tableau, or Power BI translates cleaned models into recurring dashboards the business can use.An enrichment and quality layer
Within this layer, contact verification, firmographic append, and record completion become valuable, especially for B2B segmentation and routing.
If you're comparing vendors and categories, this roundup of marketing analytics tools is a useful starting point because it covers the mix of collection, reporting, and analytics platforms that are often stitched together.
One practical note on stack design: avoid building for every possible use case upfront. Build for the decisions you make most often. Budget allocation, funnel conversion, segment performance, pipeline attribution, and retention quality usually matter more than edge-case dashboards no one opens after launch.
The best stack isn't the one with the most connectors. It's the one your team can maintain without breaking trust in the numbers every quarter.
A Practical Workflow Using Data Enrichment
A lot of B2B marketing analysis fails before analysis even starts. The CRM is full of partial records, outdated titles, duplicate contacts, missing company fields, and lead sources nobody trusts. Then the team tries to segment, score, personalize, and report from that base.
It doesn't hold.
The better workflow starts with repair, not reporting.
Start with the CRM you already have
Take a common scenario. A demand gen team wants to improve outbound support for inbound leads, tighten paid retargeting audiences, and understand which segments are progressing to opportunity. Their CRM has enough volume to work with, but the records are messy.
The first pass is operational cleanup:
Standardize key fields
Normalize job titles, company names, country values, lifecycle stages, and channel labels. This step matters more than people think. If one country appears in several forms, or lifecycle stages drift between teams, segment reporting breaks quickly.Remove or merge duplicate records
Duplicate contacts distort conversion rates, audience counts, and sales follow-up reporting. They also create personalization errors that make campaigns look less professional than they are.Flag missing commercial fields
Missing industry, employee range, company type, or account ownership doesn't just make dashboards uglier. It limits routing, targeting, and analysis.
At this point, many teams stop. They have cleaner data, but not richer data. That means they still can't answer core questions about who these leads are or which subsegments deserve focus.
A useful next step is evaluating B2B data enrichment tools that can append professional and company-level information so records become usable for segmentation and campaign logic.
Build segments around buying reality
Enrichment changes the quality of marketing data analysis.
Bain notes that companies often struggle to serve small businesses “because of incomplete data and the very diverse customer base,” and recommends defining subsegments by value drivers rather than broad firmographics in its analysis of underserved small-business segments. That point applies directly to B2B marketing ops.
A weak segment sounds like this:
- SaaS companies
- Mid-market
- Marketing leaders
A strong segment sounds like this:
- B2B SaaS accounts with a defined go-to-market team
- Marketing leaders involved in pipeline generation
- Regions where sales coverage exists
- Segments with lower buying friction and clearer service economics
The difference is that the second group can support a go-to-market decision.
Enrichment helps make that possible by filling in fields your forms rarely capture well. Depending on your stack, that might mean adding firmographics, validating work emails, resolving role seniority, or completing company records. Tools in this category include Clearbit, ZoomInfo, Cognism, and Icypeas, which provides B2B contact and company enrichment for workflows that need verified professional data.
Enrichment is valuable when it improves reachability, segmentation, and decision quality. It's not valuable just because you can append more fields.
Use performance feedback to refine the model
Once records are clean and segments are usable, campaign execution gets more precise.
Email audiences can be grouped by role and company context instead of broad lists. Paid programs can suppress poor-fit accounts and prioritize segments with stronger downstream movement. SDR handoff rules can reflect actual account characteristics instead of incomplete forms.
Then the analysis becomes much more useful, because results can be compared across meaningful groups:
By audience type
Which personas engage but don't convert? Which roles convert but stall after handoff?By company profile
Do certain industries move faster? Do smaller accounts convert efficiently but expand poorly?By reachable market
Which theoretically attractive segments are hard to contact, hard to route, or hard to close?
This last question matters. Teams often over-prioritize the segment with the cleanest signals and ignore underserved niches that are profitable but messy. Better enrichment doesn't solve that by itself, but it reduces the chance that you mistake incomplete measurement for lack of demand.
A strong workflow keeps looping:
| Step | What happens | Why it matters |
|---|---|---|
| Clean | Fix duplicates, labels, missing basics | Restores trust in core reporting |
| Enrich | Append contact and company context | Makes segmentation operational |
| Activate | Personalize outreach and targeting | Improves relevance and routing |
| Analyze | Compare segment and funnel outcomes | Finds what actually works |
| Refine | Adjust segments and rules | Prevents stale models |
That's the practical value of a first-party data foundation. It gives your team a better chance of finding segments that are not just visible in the data, but reachable and commercially worth pursuing.
Creating a Culture of Measurement and Governance
Failure in marketing data analysis often doesn't stem from a lack of tools. It occurs because nobody owns definitions, quality standards, or decision rules.
When that happens, dashboards turn into negotiation documents. Marketing, sales, and rev ops all bring different numbers into the same meeting and spend the first half arguing about which one counts.
Governance is what makes analysis trustworthy
Good governance sounds boring until you've lived without it.
At minimum, someone needs clear ownership of these questions:
- Who owns field definitions for lifecycle stages, lead sources, campaign types, and account status
- Who monitors quality for duplicates, missing values, and taxonomy drift
- Who approves changes to scoring, routing, attribution logic, and dashboard definitions
- Who decides the primary KPI when channels optimize for different local metrics
Funnel.io recommends segmenting by audience, geography, channel, and funnel stage, then comparing weekly, monthly, and year-over-year windows to avoid overreacting to volatility. It also notes that duplicate records, missing values, inconsistent labels, and outliers can distort conversion and CPA analysis in its guidance on marketing data analysis tips.
That's the technical side. The organizational side is just as important. If people can edit fields freely without standards, no analysis layer will stay clean for long.
Data literacy turns reporting into action
Governance alone won't create a data-driven team. People also need enough literacy to interpret what they're seeing.
That doesn't mean every marketer needs to build models. It means they should know how to ask better questions, challenge weak conclusions, and avoid common traps like confusing volume with quality or short-term spikes with sustained improvement.
One helpful operating model is to borrow ideas from DataTeams' data democratization plan, especially the principle that access only helps when definitions and usage norms travel with the data.
A few habits improve team behavior fast:
Review metrics in context
Don't open with channel winners. Open with business outcomes and work backward.Write down the decision before the analysis
If nobody knows what action the result should influence, the exercise usually drifts.Teach teams how uncertainty works
Not every movement means something. Some changes need more time, cleaner segmentation, or a different comparison window.Keep the customer record healthy
A well-maintained system makes every downstream dashboard better. This is one reason teams investing in a stronger marketing database software stack tend to make faster decisions. The record itself becomes more dependable.
The best measurement culture isn't obsessed with dashboards. It's obsessed with making better decisions more often.
If your team is trying to clean CRM data, enrich contact records, and build a more reliable first-party foundation for marketing analysis, Icypeas is one option to evaluate. It helps marketing, sales, and ops teams find, verify, and enrich professional contact data so segmentation, outreach, and reporting rest on records that are more complete and usable.



























































.png)



.webp)