.avif)
Marketing Data Science: A Practical Guide for 2026

.avif)
Your team probably has the same dashboard problem most B2B teams have. Paid search says it sourced demand. LinkedIn says it influenced pipeline. Email says it drove conversion. Sales says the best deals came from outbound. Finance wants a clean answer on return, and marketing ops is stuck reconciling five exports that don't even use the same account names.
That's the moment when marketing stops being a messaging problem and starts being a systems problem.
The teams that get past it don't rely on prettier dashboards. They build marketing data science into the operating model. They connect behavioral data, CRM history, campaign inputs, and customer context, then use models to answer practical questions: which leads deserve fast follow-up, which customers are drifting, which channels deserve more budget, and which experiments are worth running next. The upside is real, but it doesn't come from buying one AI tool. It comes from a phased build: clean data first, useful models second, activation third.
Table of Contents
- Attribution models
- Customer lifetime value models
- Propensity models
- Segmentation models
- Experimentation and A B testing
- Phase one gets the pipes right
- Phase two adds focused prediction
- Phase three operationalizes and scales
The Shift From Marketing Art to Marketing Science
A lot of marketing teams still run on a familiar mix of instinct, channel expertise, and post-campaign storytelling. That can work for a while. Then budgets tighten, funnel conversion gets uneven, and leadership asks a simple question that's hard to answer: what should we do next week that will improve results?
The old model was broad and demographic. The newer model is observable and testable. Once digital channels made user-level behavior visible, marketing moved toward evidence-based optimization and made A/B testing, hypothesis testing, regression analysis, decision trees, and predictive analysis part of normal decision-making, as outlined in Coursera's overview of data science in marketing. That changed the center of gravity. Marketers could compare variants, estimate lift, and optimize outcomes instead of arguing from intuition.
A team flying blind usually has the same symptoms:
- Channel silos: Paid media, CRM, web analytics, and sales data don't line up.
- Vanity reporting: Dashboards show activity, not likely outcomes.
- Reactive budgeting: Spend shifts after campaigns underperform, not before.
- Weak prioritization: Every lead gets similar treatment even though intent isn't equal.
Practical rule: If your team can describe performance but can't prioritize the next action, you don't have a data science capability yet.
A modern team behaves differently. It treats campaign history as training data. It looks for patterns in who converts, who renews, who responds to which channel, and when touchpoints matter most. Then it puts those insights back into execution. Sales gets ranked leads. Paid media gets better audience definitions. Lifecycle marketing gets churn-risk flags. Finance gets a stronger path from spend to outcome.
That's the shift. Marketing is still creative work. But the operating system underneath it has become scientific.
What Is Marketing Data Science Really
Marketing data science is easiest to understand if you think of it as a business weather system. A weather team doesn't stare at one thermometer and call it forecasting. It pulls many signals together, models patterns, and turns messy inputs into a decision like “delay the flight” or “send the alert.” Marketing data science does the same thing for pipeline, demand, retention, and spend.
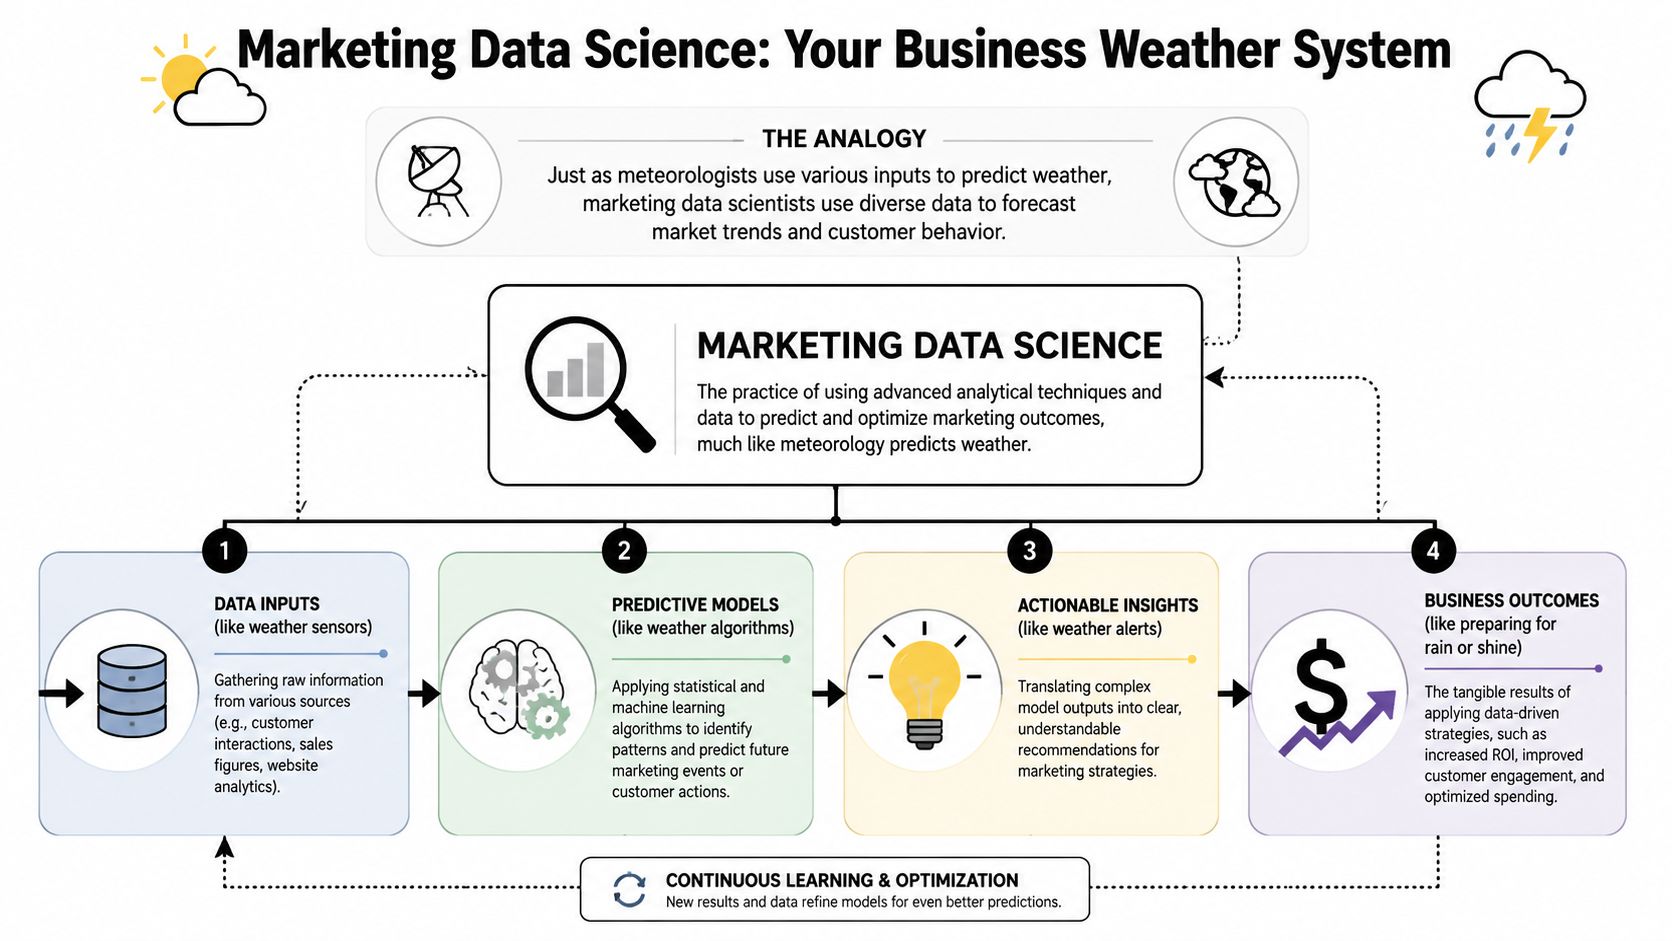
It is more than reporting
Traditional analytics tells you what happened. Useful, but incomplete. Marketing data science asks what is likely to happen and what action gives you the best chance of a better outcome.
That distinction matters. Standard reporting might show that webinar leads converted better than paid social last quarter. A data science workflow goes further. It asks which combination of company attributes, engagement signals, and channel history predicts conversion now. It may also recommend how to route, score, and sequence those leads.
If you want a simpler comparison between reporting and modeling, this guide to marketing data analytics is a useful companion read. The practical line is this: analytics summarizes. Data science helps decide.
The three working levels
Most real-world marketing data science programs operate across three levels.
| Level | Core question | Typical output |
|---|---|---|
| Descriptive | What happened? | Dashboards, funnel reporting, campaign summaries |
| Predictive | What will likely happen? | Lead scores, churn risk, expected response |
| Prescriptive | What should we do? | Budget shifts, audience prioritization, next best action |
The discipline became viable because digital marketing created trackable signals from website activity, social engagement, surveys, and online behavior. In practice, that means the inputs are broad and messy, but they are measurable. You can work with engagement histories, form fills, page depth, CRM stages, and user-generated signals instead of relying on broad assumptions.
Marketing data science isn't a report with more charts. It's statistical inference applied to live commercial decisions.
That's why the underlying methods matter. The field grew around experimentation and model-based decision-making, not just dashboards. When teams use it well, they stop asking “which campaign got the credit?” as the only question. They also ask “which person is most likely to move,” “what message should they get,” and “where is additional spend likely to have incremental impact.”
Common Models That Drive Marketing ROI
A marketing leader approves more budget for paid search because last-click reporting says search is carrying pipeline. Three months later, pipeline volume is flat, branded search is up, and organic content has been cut. The reporting was accurate within its own rules. The decision was still wrong.
That is why model choice matters. Good marketing data science connects a model to a decision, a workflow, and a data requirement. Teams get ROI from models when they know what question each one answers, what trade-off comes with it, and what data quality standard it needs to be useful.
Near the top of the stack, here's how the model picture looks:
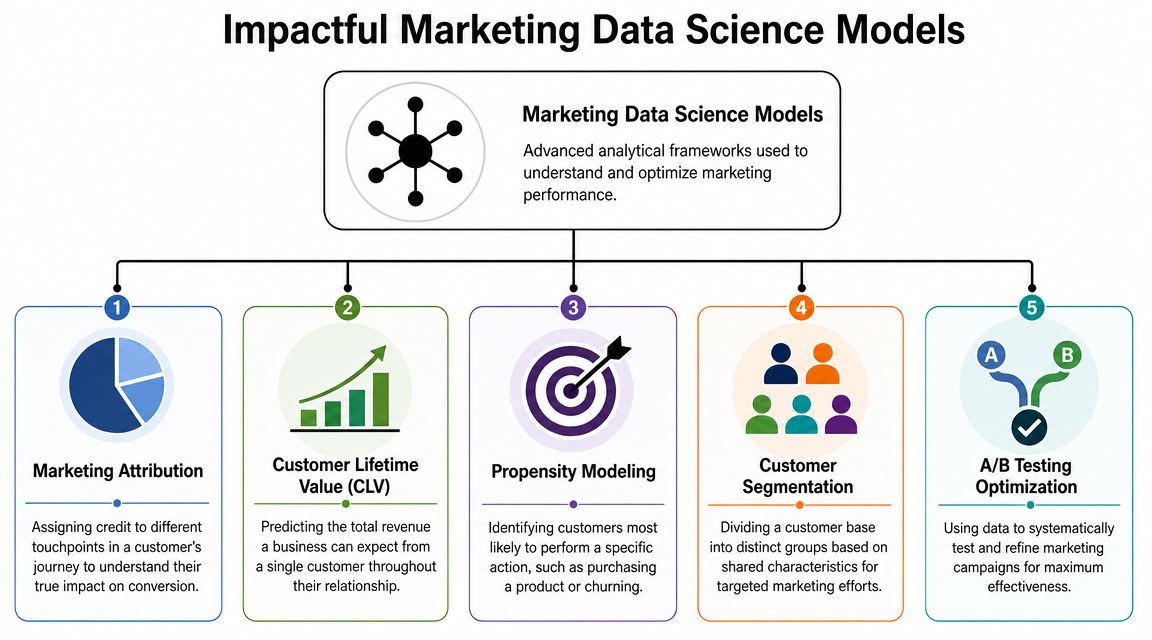
Attribution models
Business question: Which touchpoints deserve credit for conversion?
Attribution helps with budget decisions, but only when the team treats it as a directional model instead of a verdict. Last-click usually overstates demand capture. First-touch usually overstates awareness. Multi-touch is closer to reality, but it still depends on clean identity resolution, reliable timestamps, and a shared definition of conversion.
A practical B2B path often looks like this:
- A prospect first engages through organic content.
- Later they click a retargeting ad.
- Then they attend a webinar.
- Finally they respond to an SDR email and book a meeting.
A single-touch model misses how those interactions worked together. A weighted model gives a better read on contribution. An incrementality test gives a better read on causation. Mature teams use all three at different moments.
Attribution also becomes more useful when paired with channel economics. Teams comparing contribution should also compare acquisition efficiency, conversion quality, and payback. If your goal is budget control, this practical guide to lowering your cost per lead is worth reviewing alongside attribution work, because cost efficiency and conversion contribution need to be read together.
The trade-off is straightforward. Simple attribution is easy to explain and ship. Better attribution takes more work and more trust in the underlying event history.
A deeper walkthrough helps here:
Customer lifetime value models
Business question: Which customers are worth the most over time?
CLV changes how teams judge acquisition quality. Two opportunities can cost the same to generate and produce very different outcomes after the deal closes. One account renews, expands, and sends referrals. Another stalls after onboarding and never grows.
This model matters most when marketing has influence over targeting, bidding, and lifecycle design. Teams can spend more confidently on segments with stronger retention and expansion patterns. They can also stop chasing low-cost volume that looks good in quarterly reporting and weakens revenue quality over time.
In practice, CLV works best as an operating model, not a finance slide. Marketing can use it to:
- Refine audience strategy: Reduce spend on segments that convert quickly but churn early.
- Set bid logic: Pay more for segments that create stronger downstream revenue.
- Shape onboarding paths: Route high-potential accounts into higher-touch post-conversion programs.
The catch is feedback. CLV breaks down when product usage, renewal outcomes, expansion revenue, and account hierarchy are missing or delayed. A simple CLV model with complete downstream data usually beats a more advanced model fed by partial records.
Propensity models
Business question: Who is most likely to take a specific action?
Propensity models are often the first place a marketing team sees visible lift from predictive methods. They score the likelihood of a narrow outcome such as booking a meeting, starting a trial, expanding an account, or churning.
The narrower the prediction target, the more useful the workflow tends to be. I have seen teams get better results from one clean "likelihood to book demo" score than from a broad lead score trying to predict every possible outcome at once.
Common inputs include recency, frequency, product or content interest, source history, account fit, and prior sales outcomes. The exact mix depends on the motion and on the quality of the available records. A useful score starts with a disciplined feature set and a clear input inventory. This breakdown of marketing data sources for modeling and segmentation is a good reference point for that planning step.
A practical B2B lead scoring model often combines:
- Firmographic fit: Industry, company size, role, and geography
- Behavioral intensity: Pricing page visits, repeat sessions, demo page activity
- Source history: Paid, organic, referral, partner, outbound response
- Sales outcomes: Closed-won and closed-lost history from CRM
The output should guide triage. It should not replace sales judgment. Reps still need context, but the model helps them spend first attention where the probability of movement is highest.
A good propensity model predicts one action clearly enough to improve a workflow.
Segmentation models
Business question: Which groups should we treat differently?
Segmentation becomes valuable when it changes execution. Splitting accounts by company size or industry is a start. It rarely gives enough detail to change messaging, timing, offer structure, or handoff rules in a meaningful way.
The useful segments usually combine static traits with live behavior. That is how teams separate high-fit evaluators from low-fit researchers, dormant customers from expansion candidates, and price-sensitive buyers from teams that need speed or service depth.
Three segmentation styles show up often:
| Segmentation type | Best for | Common mistake |
|---|---|---|
| Firmographic | ICP alignment and territory planning | Treating static company data as sufficient |
| Behavioral | Messaging and timing | Ignoring recency and sequence |
| Value-based | Budgeting and retention focus | Using revenue only without margin or retention context |
Segments also age. A segment definition that worked six months ago can drift as product positioning changes, new channels enter the mix, or market demand shifts. Teams that refresh segmentation on a schedule usually outperform teams that set it once and leave it untouched.
Experimentation and A B testing
Business question: Did this change cause improvement?
Experimentation keeps marketing grounded in evidence. It tests whether a new offer, headline, landing page, routing rule, or pricing message changed behavior, rather than relying on post-hoc interpretation.
For many teams, a disciplined testing program creates ROI faster than an advanced model built too early. A few well-run tests on conversion paths, nurture timing, form design, or sales handoff rules can remove weak assumptions and improve throughput across the funnel.
The mistake is running tests as isolated wins. Strong teams log hypotheses, document results, and feed what they learn back into scoring, segmentation, and budget planning. That is how experimentation becomes part of the operating system instead of a collection of campaign anecdotes.
The Data Foundation Your Models Need to Succeed
A scoring model can look sharp in a deck and still fail in production by Friday.
The usual failure point is not the algorithm. It is the record quality behind it. If job titles are inconsistent, accounts are duplicated, source fields are unreliable, and lifecycle stages mean different things across teams, the model will mirror that mess at scale.
I have seen teams blame a weak score when the actual problem was simpler. They were asking the model to make fine-grained decisions from partial, conflicting data. That is like asking finance to forecast revenue from a chart of accounts no one uses the same way.
What data matters
A workable foundation usually pulls from three categories of marketing data sources:
- First-party data: CRM records, product usage, website behavior, email engagement, owned conversion events
- Second-party data: Partner or co-marketing data shared through a direct relationship
- Third-party data: External company, contact, intent, or market signals from providers
The right mix depends on the go-to-market motion. Product-led teams usually need event depth, activation milestones, and retention signals. Demand generation teams often get more value from account fit, channel engagement, and clean handoff data from sales.
The input set is broader than it used to be. Teams now use reviews, comments, shares, metadata, and digital behavior signals alongside standard CRM fields. That does not mean every new field deserves a place in the model. Keep the fields that improve a decision, not the ones that only make the dataset look bigger.
Why enrichment changes model quality
Raw records rarely carry enough context to support useful targeting or prediction. An email address tells you almost nothing about seniority, buying role, account fit, or whether the contact belongs to a live opportunity. Enrichment fills in those gaps.
A stronger record usually includes:
- Identity fields: Standardized company name, domain, person-level identifiers
- Firmographics: Industry, company size, revenue band, location, growth indicators
- Role context: Department, seniority, function, likely buying influence
- Behavioral history: Sessions, content views, form fills, ad engagement, product events
That work belongs to marketing operations as much as data engineering. If you want to boost ROAS and lower CPA, the model needs enough context to separate costly noise from costly but valuable audiences.
Clean data helps a model run. Enriched data helps a model matter.
A practical target is a single customer view. Not a perfect master profile. A joined record that gives marketing, sales, and analytics the same account, person, source, stage, campaign, and outcome definitions.
That standard matters because model performance usually breaks in ordinary places. Sales marks a lead as qualified based on conversation quality. Marketing marks it qualified based on form completion and fit. Analytics pulls pipeline from opportunity records with a different account key. Now the team is debating score thresholds when the actual issue is that three systems are grading different objects.
For account-based teams, enrichment often makes the difference between a generic score and one people trust. A pricing-page visit means more when the visitor works in the target function, sits inside a target account, and shows up during an active buying cycle.
If the data layer is thin, resist the urge to add model complexity. Fix the schema, standardize the definitions, enrich the record, and close the obvious gaps first. That is the foundation that gives later models a real chance to produce ROI.
Building Your Marketing Data Science Capability
Most companies don't need to hire a full team on day one. They need a build sequence. The fastest path is usually phased, with each phase producing something the business can use.
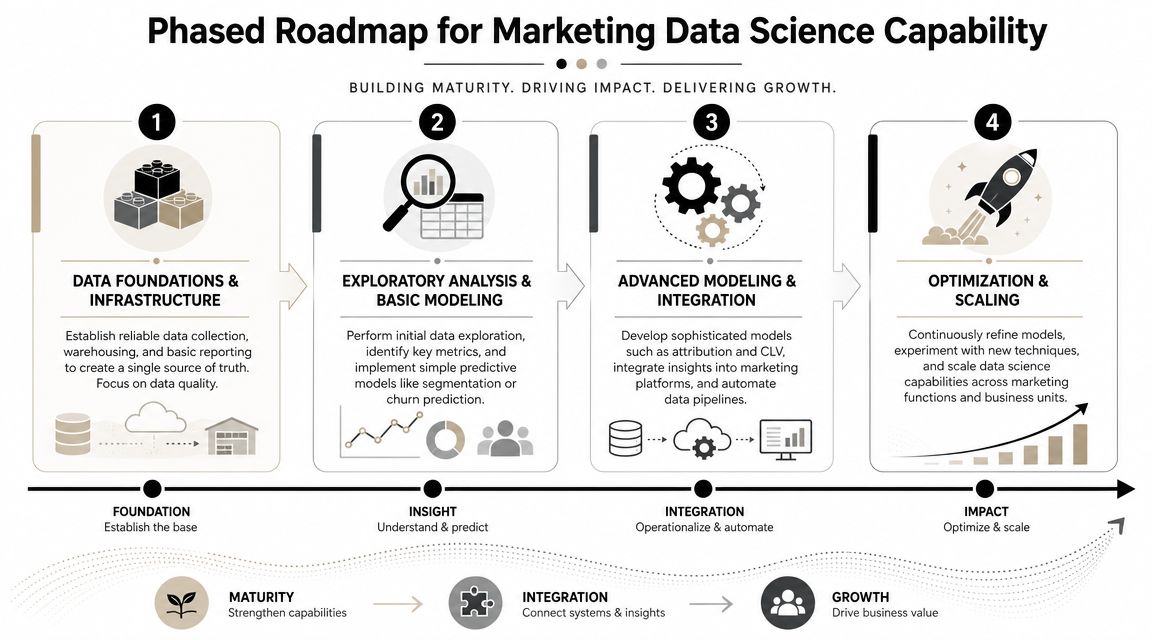
Phase one gets the pipes right
The first phase is not glamorous. It's where disciplined teams win.
Start by making core data reliable across CRM, web analytics, ad platforms, and revenue systems. Build one place where those records can be joined. Standardize campaign naming, lifecycle stages, source definitions, and account identifiers. If different teams use different timestamps for “created,” “qualified,” or “won,” stop and fix that first.
In this phase, the deliverables should be operational:
- A usable warehouse: One source of truth for marketing and revenue analysis
- Trusted KPI definitions: Shared rules for conversion, source, stage, and attribution logic
- Basic QA routines: Duplicate checks, null monitoring, naming audits, field validation
What doesn't work is jumping straight to machine learning while the pipeline is still unstable. You'll spend more time explaining exceptions than using insights.
Phase two adds focused prediction
Once the data is stable enough, introduce one predictive use case tied to a workflow. Lead scoring is common because the payoff is visible. Churn risk can be strong if your lifecycle data is clean. Account prioritization also works well in B2B because it aligns marketing and sales around the same targets.
Role clarity matters.
| Role | Primary responsibility | Common failure mode |
|---|---|---|
| Marketing analyst | Reporting, diagnostics, performance interpretation | Gets stuck producing dashboards only |
| Marketing ops or technologist | Data flow, integration, field governance, activation | Owns systems but not decision logic |
| Data scientist | Model design, training, validation, feature engineering | Builds in isolation from workflow reality |
The best setup is collaborative. Analysts surface patterns. Ops makes the data usable and deployable. Data scientists build and validate models. Revenue leaders decide where outputs should change action.
Don't start with five models. Start with one model that changes a real queue, route, budget, or sequence.
Phase three operationalizes and scales
The third phase is where marketing data science stops being a side project and becomes part of execution. Scores flow into CRM views. Segments sync to ad platforms. Experiment results feed planning. Forecasts influence spend pacing. Model outputs are reviewed as part of weekly operating rhythm, not quarterly innovation theater.
You also start handling harder questions here. How often should scores refresh? Which teams can override them? What happens when the model conflicts with rep judgment? Which model version is active in production?
A practical maturity path often looks like this:
- One workflow, one model: Lead prioritization or churn scoring
- Two-way feedback: Sales and CS outcomes improve the training set
- Channel activation: Scores and segments are used in paid, email, and outbound
- Governance: Monitoring, retraining rules, and ownership are defined
A common mistake at this stage is over-automating weak logic. If your model is directionally useful but not stable enough for auto-routing, keep a human review layer. Automation should amplify confidence, not hide uncertainty.
The capability becomes durable when teams stop asking who “owns the model” and start asking which commercial decision the model improves. That's the right center of gravity.
Essential Tools and the Technology Stack
A working marketing data science stack is less about picking famous vendors and more about covering every function from ingestion to activation. Gaps between layers cause more trouble than weak features inside any one tool.
The stack by function
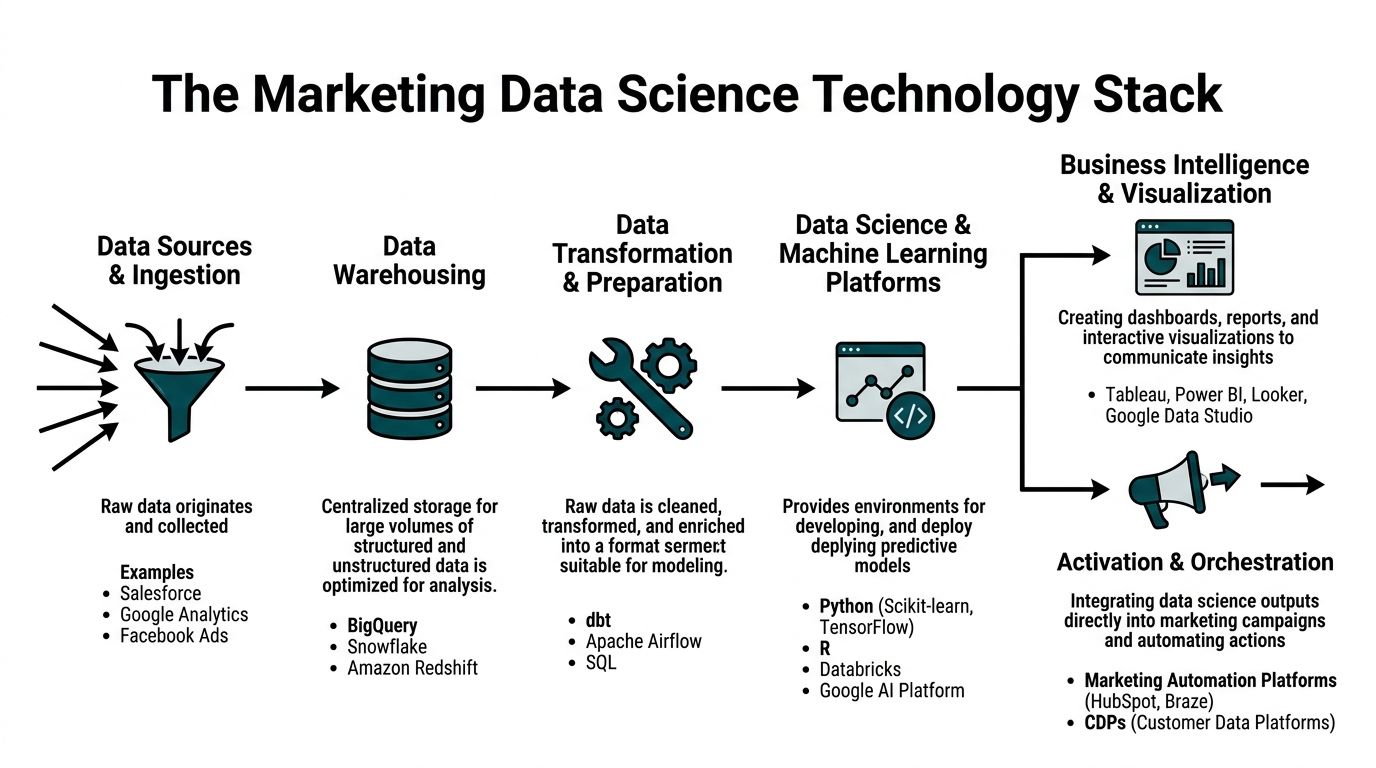
A practical stack usually has six layers.
Data sources and ingestion come first. That includes CRM systems like Salesforce, ad platforms, web analytics, product events, and marketing automation tools. If collection is inconsistent at this step, everything downstream inherits the mess.
Data warehousing is where the records land and join. BigQuery, Snowflake, and Redshift are common choices because they can hold marketing, product, and revenue data in one analytical environment.
Transformation and preparation is the layer many teams underestimate. SQL models, dbt, orchestration tools, and QA checks turn raw tables into trusted entities like accounts, contacts, opportunities, campaign touches, and lifecycle events.
Modeling environments usually sit in Python, R, notebooks, or platform environments where teams can train and validate models. The point isn't just building a score. It's making the training data reproducible.
Business intelligence tools such as Tableau, Looker, or Power BI make outputs visible. Not every stakeholder needs a notebook. They do need a clear operational view.
Activation and orchestration pushes outputs back into action. That includes CRMs, CDPs, ad platforms, sales engagement tools, and lifecycle systems.
If you're comparing categories before buying, a curated overview of marketing analytics tools helps frame what belongs in each layer.
How the layers work together
The right stack behaves like a loop, not a ladder. Data enters, gets standardized, informs a model, and then returns to execution systems where new outcomes are created and captured. If one layer is manual, slow, or disconnected, the loop breaks.
A simple decision test helps:
- If the question is storage, solve it in the warehouse.
- If the question is trust, solve it in transformation and governance.
- If the question is prediction, solve it in the modeling layer.
- If the question is adoption, solve it in BI or activation.
For stack planning, broad tool directories can be useful. A resource like the Tekk.coach platform can help teams scan categories and compare options before narrowing to a shortlist.
One more point matters for operators. APIs often decide whether a stack is workable. Enrichment, verification, and sync layers need to move data cleanly between systems. In that context, Icypeas is one option teams use for professional contact enrichment and verification through API, especially when they need to enrich inbound or CRM records before scoring and routing.
What doesn't work is buying overlapping platforms without a data contract. When two tools both claim to own identity, attribution, or audience state, someone on the ops team ends up reconciling conflicts by hand.
Practical Playbooks and Future Outlook
At 9:00 a.m., sales says the lead queue is full of junk. By 11:00 a.m., paid media wants more budget. By 2:00 p.m., the dashboard shows movement, but no one can explain what changed in the business. That is the real test for marketing data science. It has to improve a decision a team makes every day, with data that is clean enough to trust and a workflow people will use.
Finding the next best customer
One of the highest-return starting points in B2B is lead and account prioritization. The question is simple: which inbound accounts deserve a fast sales response, and which should stay in nurture until intent is clearer?
The model matters, but the setup matters more. Pull recent leads and accounts from the CRM. Join behavioral signals such as pricing page visits, repeat sessions, form fills, webinar attendance, and campaign responses. Add fit data such as company type, team size, role, and account context. Then train against one downstream outcome, usually a stage change the business already trusts, such as qualified meeting or opportunity creation.
Feature design usually separates a useful score from a noisy one. Single events are weak signals. Combinations carry more weight. Recent activity plus repeated engagement says more than either signal alone. Role fit plus account-level research activity is stronger than role fit by itself. A director from the right function at an account showing active buying behavior should rank above a student browsing one blog post.
A practical rollout looks like this:
- Pick one outcome. Do not predict a vague concept like pipeline quality. Predict one stage change.
- Build features from fit and behavior. Include who the person is, what the account looks like, and what both have done recently.
- Route based on score bands. High-confidence records go to fast follow-up. Mid-range records stay in nurture or get lighter-touch SDR review.
- Feed outcomes back into the model. Accepted, rejected, recycled, and converted records all improve the next round.
The trade-off is operational, not mathematical. A scoring model creates value only if it changes the SLA, routing logic, or rep behavior. If every lead still lands in the same queue, the model becomes another dashboard artifact.
Improving channel spend decisions
Budget allocation is the second playbook, and it is harder because the feedback loop is slower. The working question is not which channel got credit. It is where the next dollar is likely to produce incremental return.
Multi-touch attribution is often the first step because it sits close to campaign execution and can be deployed without a full econometrics program. Start by stitching touch history across ads, site visits, email, events, and sales outreach. Use consistent lookback windows. Define the business outcome before building reports. Lead creation, opportunity creation, and closed-won influence produce very different channel rankings.
Clean dashboards can create false confidence. Touch data shows where buyers interacted. It does not always tell you what caused movement.
This limitation explains why the field is expanding beyond classic digital attribution. More advanced measurement work accounts for time lags, adstock or carryover, and interaction effects, which matter in multi-channel programs with long sales cycles. The direction is toward combining MMM, incrementality testing, and privacy-aware pipelines rather than relying only on user-level attribution, as described in this discussion of advanced measurement approaches.
Good measurement separates exposure from impact. Better measurement also accounts for delay, overlap, and channel interaction.
The practical roadmap is phased. Start with attribution that is clean enough to support weekly optimization. Add experiments where channel spend or audience splits make causal testing possible. Then add broader measurement models for quarterly and annual budget planning. Teams that skip straight to advanced modeling often fail for a simple reason: the input data is inconsistent, and no one agrees on the outcome definition.
The next few years will favor marketing teams that can operate at two levels at once. User-level data still helps with tactical execution. It no longer covers the whole system. Privacy limits, cross-device gaps, and platform reporting constraints have changed the measurement standard. Strong teams use attribution for day-to-day decisions, experiments for causal validation, and larger-scale models for budget strategy.
This path is not limited to enterprise brands with research teams and long implementation cycles. Mid-market teams can build it in the same order that works in practice: clean and enriched data first, one decision-focused model second, workflow activation third, and more causal measurement over time.
If your team is trying to turn messy lead records and disconnected campaign data into something models can use, Icypeas can fit into that workflow by helping enrich and verify professional contact data before it reaches scoring, routing, or CRM cleanup processes.


.png)


.webp)