.avif)
Marketing Data Analytics Jobs: A Complete 2026 Career Guide

.avif)
Marketing data analytics jobs aren't just “marketing roles with spreadsheets.” They sit inside a labor market that's expanding fast enough to change how teams hire and how candidates should prepare. The U.S. Bureau of Labor Statistics projects 19% growth for marketing analyst roles, while related data scientist roles are projected to grow 34% from 2024 to 2034, with about 23,400 openings per year in the U.S. alone, according to Harvard DCE's summary of labor market data.
That changes the career question. The issue isn't whether there are opportunities. The issue is whether you're preparing for the practical job, which usually means building data pipelines, cleaning messy inputs, and helping marketers, sales leaders, and RevOps teams make decisions they'll implement.
Most beginner advice stops at “learn SQL.” That's necessary, but it's not enough. The stronger path is to understand what kind of analyst you want to become, what systems that role touches, and how to move from dashboard maintenance to decision support.
Table of Contents
- The Booming Demand for Marketing Data Analysts
- Where the role is splitting
- How seniority changes the work
- Build proof, not just knowledge
- Portfolio projects that map to real work
- What hiring managers actually want to see
The Booming Demand for Marketing Data Analysts
Marketing analytics hiring is growing fast, but the headline number matters less than the reason behind it. Companies now expect analysts to connect spend, funnel performance, pipeline quality, and forecasting across several systems, then turn that analysis into a recommendation someone can act on.
That change has raised the bar for the job. A marketing analyst used to be valuable for reporting on campaign performance after the fact. The stronger roles now sit closer to revenue decisions because marketing data is scattered across ad platforms, web analytics, CRM records, product usage data, and BI tools. Someone has to reconcile definitions, catch tracking gaps, and explain what the numbers mean before a team wastes budget or misreads channel performance.
That is why demand keeps rising. The role has expanded from reporting into data pipeline ownership, measurement design, and decision support.
A mature team usually wants an analyst who can answer questions like these: Are we buying leads the sales team wants? Which source looks efficient only because attribution is incomplete? Where did conversion rates drop, and is the cause traffic quality, form friction, routing logic, or bad tracking?
Practical rule: If a company says it wants a marketing analyst, assume it wants support for revenue decisions, not someone who only refreshes dashboards.
For career changers, this is the opportunity. The market does not reward generic claims about being data-driven. It rewards analysts who can work through messy handoffs between systems and help marketers make better calls with incomplete information.
To stand out, focus on three skills:
- Connect systems. Work across CRM data, web analytics, ad platforms, and BI tools without getting lost in ownership gaps.
- Frame business questions clearly. Move past "what happened" and ask why lead quality changed, which channels are creating pipeline, or where measurement broke.
- Recommend action. Tell a paid media manager, demand gen lead, or RevOps partner what to change next and what trade-off comes with that change.
Hiring managers are also getting more specific about what they need. Some need a campaign analyst who can diagnose CAC and conversion issues. Others need someone closer to marketing operations who can clean lifecycle stages, fix attribution logic, and improve lead routing. If you want a good snapshot of how employers describe the role in practice, Find marketing data talent with Nexus IT. The useful takeaway is not the title. It is the mix of systems, metrics, and business decisions the role owns.
The Spectrum of Marketing Data Analytics Roles
The title “marketing data analyst” sounds tidy. The actual market isn't tidy at all. It's fragmenting into specialized tracks, and that's a good thing because specialization usually makes your profile easier to understand and more valuable to the right employer.
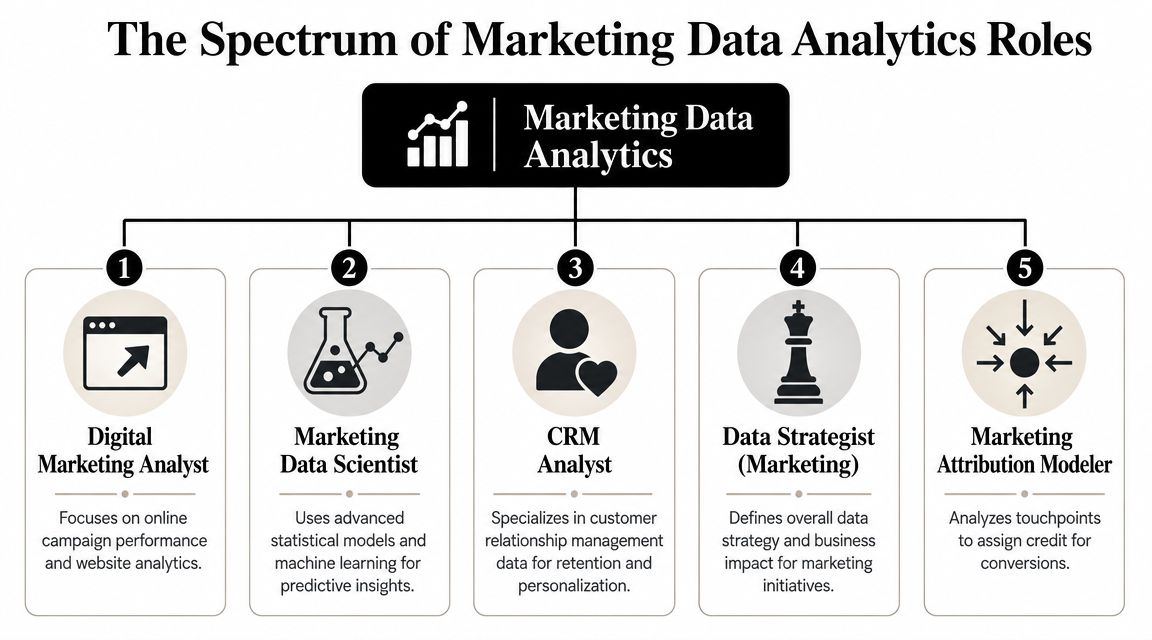
Where the role is splitting
NC State highlights a broad range of attainable analytics-related titles, and the U.S. Bureau of Labor Statistics projects 13% growth for market research analysts from 2022 to 2032 alongside roughly 94,600 annual openings, as summarized on NC State's marketing analytics careers page. That's the clearest signal that the field isn't one lane anymore.
Here's how I'd break this area down in practical terms:
| Role track | What they usually own | Best fit for |
|---|---|---|
| Digital marketing analyst | Campaign performance, web behavior, conversion trends, channel measurement | People who like acquisition, funnels, GA4, paid media, and experimentation |
| Marketing operations analyst | Lead flow, scoring logic, lifecycle stages, CRM hygiene, handoff quality | People who like systems, process design, and cross-functional troubleshooting |
| Market research analyst | Customer behavior, segmentation, survey work, competitor patterns | People who enjoy structured research and pattern finding |
| Product or growth-facing analyst | Feature usage, onboarding paths, activation signals, retention questions | People who want to work at the edge of marketing and product |
| Attribution or measurement specialist | Touchpoint logic, conversion credit, tracking setup, reporting standards | People who like messy measurement problems and cross-channel analysis |
None of these roles are “better” in the abstract. The better choice is the one that fits how you think.
If you like tracing data from ad click to closed-won opportunity, you'll probably be happier in digital analytics or attribution. If you like fixing field mapping, lead routing, and lifecycle definitions, marketing ops is often the stronger path. If you enjoy turning broad customer patterns into positioning or pricing insight, market research can be the cleaner fit.
A useful way to study the market is to look at real job descriptions by specialization, not just title. If you want examples of how employers frame the work, Find marketing data talent with Nexus IT is a helpful reference for role scope and expectations.
How seniority changes the work
Junior analysts often think seniority means “more dashboards.” It usually means something else.
- Entry-level work often starts with QA, recurring reporting, spreadsheet cleanup, tagging checks, and basic SQL pulls.
- Mid-level work usually adds diagnosis. You're expected to explain why performance changed, not just show that it changed.
- Senior work shifts toward decision design. You define metrics, shape tracking plans, influence budget conversations, and push back when stakeholders ask the wrong question.
- Manager-level work is less hands-on in some teams. You review methods, set standards, prioritize requests, and translate business strategy into analytical workstreams.
A good specialization narrows your learning path. A bad one narrows your judgment. Stay specialized in tools and domain, but broad in business understanding.
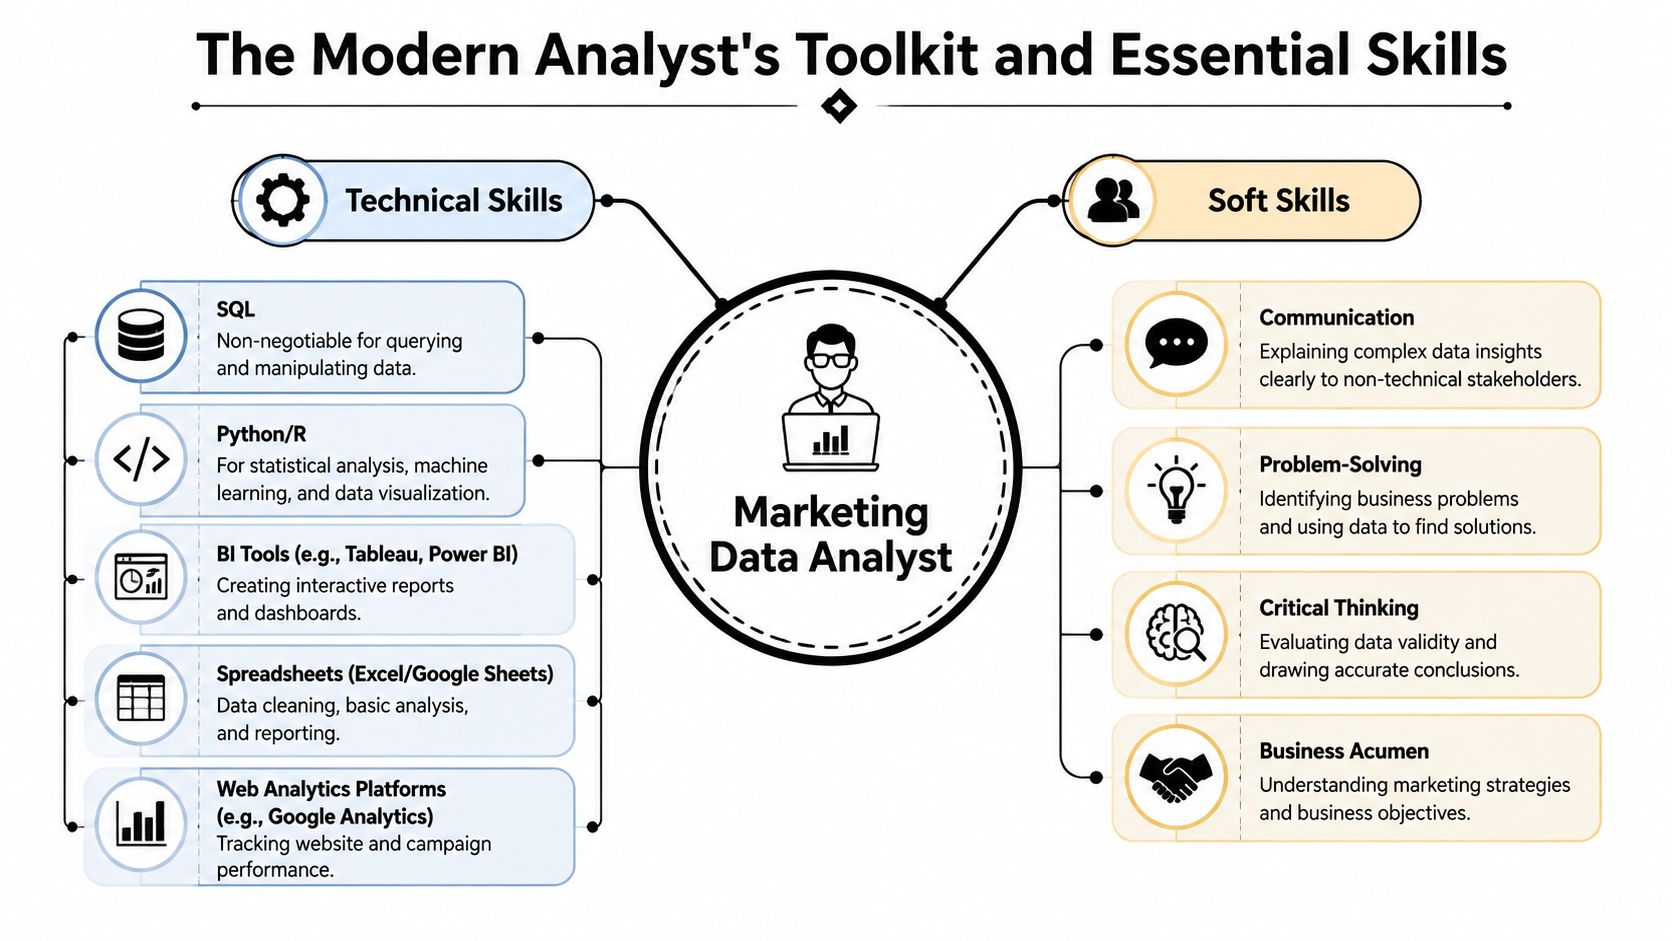
The Modern Analyst's Toolkit and Essential Skills
The modern role runs on a SQL + BI + statistical analysis stack. That's not academic advice. It's how the work gets done. As described in this marketing analyst job description overview from AppleOne, job descriptions commonly require proficiency in SQL, Excel, Python or R, and a BI tool such as Tableau or Power BI because analysts need to extract, clean, join, and present data that supports business decisions.
The core stack in practice
If you're early in your career, don't treat tools as a shopping list. Treat them as a pipeline.
SQL pulls the source data
This is the foundation. SQL lets you work with CRM tables, web events, campaign metadata, and revenue records directly. Without it, you're stuck waiting for exports or trusting someone else's model.
Excel or Google Sheets handles fast inspection
Spreadsheets still matter. They're useful for spot checks, lightweight calculations, quick pivots, and stakeholder-friendly reviews before a result gets formalized elsewhere.
Python or R moves you beyond manual analysis
You don't need to become a full-time programmer on day one. You do need enough fluency to automate repeated tasks, clean messy files, compare cohorts, and run more rigorous analysis when a spreadsheet starts to break down.
BI tools turn findings into decision interfaces
Tableau, Power BI, and similar tools matter because teams need shared visibility. But a dashboard is only useful if the underlying logic is sound.
Analytics platforms and tagging tools close the loop
GA4 and Google Tag Manager often sit closer to collection and event definition. They're where many analysts discover whether the reporting problem is a tracking problem.
A good next step is to compare the categories of platforms you'll likely touch on the job. This overview of best marketing analytics tools is useful for understanding how analytics, reporting, and activation tools fit together.
What soft skills actually matter
Soft skills get discussed in vague ways. On the job, they're concrete.
- Communication means explaining metric logic to non-analysts without sounding defensive.
- Critical thinking means questioning whether a conversion drop is real or the result of broken tracking.
- Business acumen means knowing that a prettier dashboard doesn't matter if sales is complaining about lead quality.
- Problem-solving means narrowing a broad request into a testable question.
Here's what doesn't work. Saying you're “passionate about data storytelling” without being able to show how you changed someone's decision. Hiring managers hear that line constantly.
What works is showing your reasoning. For example:
- You noticed a form-fill spike but checked whether source quality changed.
- You compared campaign performance against downstream CRM stages, not just top-of-funnel volume.
- You found duplicate records or inconsistent UTM conventions before publishing conclusions.
- You simplified a confusing readout into three decisions a manager could act on.
On the job test: If your analysis ends with “interesting trend” instead of “here's what we should change,” you're still acting like a reporter.
The strongest analysts I've worked with aren't always the flashiest dashboard builders. They're the people who can trace an issue across systems, defend their definitions, and keep stakeholders focused on the decision rather than the chart style.
A Day in the Life of a Marketing Data Analyst
A normal week rarely looks like a classroom exercise. It looks more like interruptions layered on top of recurring work, with a few deeper investigations that create value.
What a normal week looks like
Monday usually starts with review work. An analyst checks campaign pacing, validates whether weekend data landed correctly, and updates a weekly performance view for demand gen or paid media. Some of that happens in a BI tool. Some of it happens in SQL because a stakeholder doesn't trust a metric and wants to know what's underneath it.
Tuesday often brings the first ad hoc request. Sales says lead quality dropped. Marketing says volume looks fine. RevOps says lifecycle progression is lagging. The analyst's job isn't to take sides. It's to compare the definitions, pull the records, and identify whether the issue is traffic mix, form quality, routing logic, or attribution noise.
By midweek, the work usually gets more diagnostic. You join CRM and campaign datasets, look at cohorts by source or segment, and figure out where performance changed first. Sometimes the answer is strategic. Sometimes it's embarrassing and operational, like a broken event, a missing parameter, or a form field that changed without warning.
Most “performance problems” start as measurement problems or process problems. Good analysts know to check those before writing a strategic recommendation.
Thursday is often communication day. You turn a messy analysis into a short readout for a marketing meeting, a Slack summary for a channel owner, or a slide with a recommendation tied to budget, targeting, or tracking fixes.
What separates good analysts from report pullers
The weak version of the role is passive. Pull report. Update dashboard. Wait for next request.
The stronger version is more active:
- You verify data before sharing it. That saves people from making decisions on broken tracking.
- You add context. You don't say “MQLs are down.” You say which segment moved and where the drop started.
- You recommend next steps. Shift budget. Audit UTMs. Review routing. Rebuild an event. Tighten audience definitions.
- You follow the issue through. You don't disappear after sending the chart.
A lot of junior analysts think productivity means responding fast to every request. It doesn't. It means separating recurring reporting from work that changes decisions.
The best days in this job don't come from making a dashboard prettier. They come from catching the reason a team has been optimizing the wrong thing.
How to Build Your Analytics Career Path and Portfolio
If you want one reliable shortcut into marketing data analytics jobs, it's this. Build evidence that you can do the work before someone pays you to do it.

Build proof, not just knowledge
Courses help. Certifications can help. Degrees matter in many roles. But hiring managers still want to see whether you can take a business question, work through messy data, and land on a usable conclusion.
That's why your portfolio matters more than a list of completed lessons.
A strong portfolio piece usually includes:
- A real question such as which channels bring higher-quality leads, why conversion rate changed, or how user segments behave differently.
- Messy input data rather than a polished sample file.
- A documented method that shows joins, assumptions, cleaning logic, and metric definitions.
- A business recommendation that shows judgment, not just analysis.
If you need examples of what strong analysis looks like in a marketing context, this guide to marketing data analysis is a useful starting point for framing projects around actual business decisions.
Portfolio projects that map to real work
Don't build five versions of the same dashboard. Build projects that demonstrate different muscles.
Project idea one
Take a public marketing or e-commerce dataset and create a lead-to-outcome analysis. Show acquisition source, segment behavior, and downstream quality differences. Then write a short memo explaining where you'd cut spend, where you'd test more budget, and what measurement caveats remain.
Project idea two
Use GA4-style event data or a web analytics export to map a conversion funnel. Focus on where users drop off, what events are essential, and where tracking ambiguity could distort interpretation.
Project idea three
Create a CRM hygiene audit. Show duplicates, missing fields, inconsistent lifecycle mapping, or broken source values. This kind of project stands out because it looks like actual operations work, not portfolio theater.
Project idea four
Build a cohort analysis in SQL, then publish the result in Tableau Public or Power BI. The point isn't visual flair. The point is to show that you can move from raw data to a stakeholder-ready view.
A useful supplement is hearing how practitioners talk through entry paths and trade-offs. This video is worth watching before you decide what to build first.
What hiring managers actually want to see
They usually care less about whether your portfolio is pretty and more about whether it feels credible.
Use this checklist:
- Show your assumptions. If you define a qualified lead, explain the logic.
- Include at least some SQL. Screenshots alone aren't enough.
- Keep the business framing tight. Start with the question, not the tool.
- Acknowledge limitations. Good analysts know where the data is weak.
- Write like a teammate. Your audience is a manager, not a professor.
A portfolio should make it easy for someone to imagine handing you a real problem. If it only proves you can click through a dashboard tool, it's not enough yet.
Landing Marketing Data Analytics Jobs and Acing the Interview
A lot of candidates apply to marketing data analytics jobs as if job descriptions are literal checklists. They're not. They're signals. Your job is to decode what the team is struggling with.
How to read job descriptions correctly
Recent postings often emphasize GA4, Google Tag Manager, Looker Studio, attribution, and cross-functional communication, but they're often less explicit about the depth of SQL, Python, or data modeling needed. As reflected in current Indeed listings for marketing analyst roles, the stronger demand is for analysts who can move beyond simple reporting and demonstrate skills in custom-event implementation, attribution modeling, and multi-channel measurement.
That means you shouldn't read “dashboarding experience required” as “this job is mostly dashboarding.” In many cases, it means the team already has dashboards and doesn't trust them, or has data coming from multiple systems and needs someone who can sort out the logic.
Look for clues:
- If the posting mentions GA4 and GTM, the team probably has tracking or event-definition problems.
- If it mentions attribution, expect arguments about channel credit, conversion paths, or source consistency.
- If it mentions CRM and marketing automation together, expect lead lifecycle and handoff issues.
- If it asks for storytelling, expect stakeholders who aren't aligned on metrics.
The best interview prep starts with this question. What business pain would make a company open this role right now?
Your resume should reflect that reading. Don't just list tools. Tie them to outcomes and responsibilities. “Built Tableau dashboards” is weak. “Joined CRM and campaign data in SQL and built reporting used for channel budget decisions” is much stronger because it implies both technical depth and business relevance.
Interview signals that matter
Interviews usually test three things at once. Can you reason with data, can you communicate clearly, and can you handle ambiguity without freezing.
Expect some version of these prompts:
- Behavioral prompt about a time you used data to influence a decision
- Technical prompt that asks how you'd structure a query or validate a metric
- Case prompt about a campaign drop, attribution conflict, or lead-quality issue
- Stakeholder prompt about explaining a finding to a non-technical manager
When you answer, don't rush to the tool. Start with the business question, then the data sources, then the method, then the recommendation.
For focused prep on how analysts are typically assessed, this resource on mastering data analyst interview skills is worth reviewing.
A few practical mistakes to avoid:
- Don't bluff technical depth. If you've used SQL for filtering and joins but not window functions, say so.
- Don't over-index on dashboards. Employers want interpretation, QA, and decision support.
- Don't ignore implementation details. Event tracking, field definitions, and source consistency often matter as much as analysis.
- Don't answer in abstractions. Use a concrete example, even if it came from a portfolio project.
Candidates usually lose momentum when they present themselves as tool users. They gain momentum when they present themselves as analytical problem solvers who understand marketing systems.
Supercharge Your Analysis with Data Enrichment
Most analysts spend their first phase working only with internal data. That's normal. It's also limiting.
Why better input data changes the analyst's value
When your records only contain a form fill, an email address, and a few campaign fields, your analysis stays shallow. You can report lead counts, source mix, and maybe conversion by channel. Once the data is enriched with professional and company context, segmentation gets sharper and the analysis becomes more useful to revenue teams.
With enriched data, an analyst can compare performance by role, company profile, industry, or account characteristics instead of treating every inbound lead as roughly the same. That improves lead scoring logic, campaign segmentation, and the quality of downstream reporting.
Here, many analysts shift from reactive reporting to proactive strategy. They stop asking only “which campaign generated more form fills?” and start asking “which campaign brought the right type of buyer?”
If you want to understand the category better, this overview of B2B data enrichment tools is a practical place to start.
Better analysis rarely starts with a fancier chart. It usually starts with better underlying records.
The analysts who become especially valuable aren't always the ones with the most advanced notebook work. They're often the ones who improve the quality and usability of the data everyone else depends on.
Your Future in Marketing Analytics
Marketing analytics is a strong career path, but the winners in this field usually aren't the people who collect the most certificates. They're the people who pick a specialization, learn the data pipeline behind it, and build a track record of useful decisions.
Start with the fundamentals. Then get specific. Learn how your chosen niche measures success, where the data breaks, and which questions the business keeps struggling to answer.
A good analyst reports what happened. A strong one explains why. A great one helps the team decide what to do next.
If you're working with incomplete lead data, anonymous sign-ups, or low-context CRM records, Icypeas can help enrich professional and company data so your analysis, segmentation, and routing decisions are based on stronger inputs.


.png)


.webp)