.avif)
Marketing Data Analytics: A Complete 2026 Guide

.avif)
You're probably dealing with some version of the same problem most marketing teams hit once spend, channels, and stakeholders scale up. Google Ads says one thing. Your CRM says another. Product analytics has a third story. Finance wants a clean number for pipeline contribution, and someone still wants to make a budget call based on last quarter's “top performing campaign” without checking whether the leads ever became customers.
That's where marketing data analytics stops being a reporting exercise and becomes an operating system. The teams that get value from it aren't just pulling dashboards. They're building a way to trust their data, enrich what's missing, and turn messy signals into decisions that affect budget, targeting, forecasting, and sales follow-up.
Clean data matters more than generally recognized. If lead records are incomplete, channel tags are inconsistent, and identities don't match across systems, the model is wrong before the dashboard loads. Accurate analysis depends on complete inputs. That's why data quality and enrichment belong in the foundation of the stack, not as an afterthought.
Table of Contents
- Where the value shows up
- What works and what doesn't
- Competitive advantage comes from speed and confidence
- The metrics that actually guide decisions
- Segment-level analysis changes the answer
- Models for different questions
- How data moves through the system
- Where pipelines usually break
- Why enrichment belongs in the transform layer
What Marketing Data Analytics Really Means
Marketing data analytics starts when a team stops asking only “what happened?” and starts asking “why did it happen, what should we change, and what's likely to happen next?”
That sounds obvious, but the bulk of time is still spent reconciling exports, debating attribution, and patching tracking gaps. The result is a lot of reporting and very little operational clarity. A dashboard can tell you form fills dropped. Analytics should tell you whether the drop came from a channel mix shift, weak traffic quality, a broken handoff, poor audience fit, or a conversion problem on a specific device or segment.
One published industry source says 53% of marketing decisions are influenced by marketing analytics, and 75% of marketers expect analytics to become even more important. The same source also points to core metrics such as conversion rate, customer acquisition cost, customer lifetime value, click-through rate, and website traffic as central to the discipline of modern measurement according to OWOX's overview of marketing analytics in business decisions.
Reporting is not analysis
Reporting is a snapshot. Analytics is decision support.
A weekly report might show:
- Traffic increased: Sessions rose after a paid push.
- Leads fell: Form completions didn't keep pace.
- CAC worsened: Cost climbed faster than closed business.
Useful, but incomplete. Analytics adds context across source systems, segments, and time windows. It asks what changed in targeting, creative, offer, routing, conversion path, and follow-up. It also checks whether the underlying records are reliable enough to support a decision.
Practical rule: If your team can't explain a performance change in operational terms, you have reporting. Not analytics.
The business job of analytics
At a mature level, marketing data analytics does four jobs well:
- Measures performance consistently across campaigns, channels, and funnel stages.
- Connects marketing activity to business outcomes like qualified pipeline, revenue contribution, and retention.
- Supports planning so teams can allocate budget with less guesswork.
- Improves execution by showing which audiences, offers, and workflows deserve attention.
It also depends on source discipline. If your UTM taxonomy is loose, CRM stages are inconsistent, or lead records arrive half-empty, your interpretation will drift. Mapping and documenting your marketing data sources is usually the first fix, because you can't build trustworthy analytics on top of systems nobody has aligned.
The Core Benefits of Mastering Marketing Analytics
The biggest benefit of marketing data analytics is simple. It lets you move money, time, and people toward what works.
Without that, teams overfund channels that look busy, underinvest in segments with strong downstream value, and keep low-quality workflows alive because they create surface-level activity. Once analytics becomes part of operating rhythm, those mistakes get easier to catch.
Where the value shows up
The gains usually appear in a few practical places:
- Budget allocation gets tighter: Teams stop treating spend as evenly productive and start funding channels, campaigns, and audiences based on contribution to real outcomes.
- Customer quality becomes visible: You can separate leads that convert quickly from leads that only inflate top-of-funnel reporting.
- Funnel leakage is easier to diagnose: Instead of saying “sales isn't following up” or “marketing traffic is bad,” you can trace where the drop-off starts.
- Planning improves: Historical performance gives finance and revenue leaders a better base for forecasting, even if no model is perfect.
- Personalization gets smarter: Segment-level insight supports more relevant messaging, handoff rules, and lifecycle campaigns.
A lot of teams expect analytics to produce a magical insight. In practice, its value is cumulative. It removes waste, clarifies trade-offs, and makes routine decisions better week after week.
What works and what doesn't
What works is boring in the best way. Clear metric definitions. Shared naming conventions. Segment comparisons. Review cadences tied to actual decision points. Analysts and operators looking at the same numbers.
What doesn't work is also predictable:
| Approach | What happens |
|---|---|
| Channel reports in isolation | Each platform overstates its value |
| Dirty CRM data | Lead quality analysis becomes unreliable |
| Vanity metrics without funnel context | Teams optimize for activity, not outcomes |
| Last-click thinking for every decision | Brand, nurture, and assist channels get undervalued |
| One global average | Strong and weak cohorts cancel each other out |
Analytics earns trust when it changes a decision, not when it produces a prettier dashboard.
Competitive advantage comes from speed and confidence
The practical edge isn't just “being data-driven.” It's being able to react faster with fewer internal arguments.
When a market shifts, a campaign fatigues, or a new audience starts converting, the team with cleaner data sees it sooner. That team can rework creative, change routing logic, shift spend, or revisit qualification rules before everyone else catches up.
This is also why data enrichment matters. If records are missing job titles, company attributes, industry context, or verified contact information, the analysis gets softer. Segments blur together. Lead scoring gets weaker. Personalization logic misses. Good analytics doesn't start in the BI layer. It starts with complete, usable records.
Key Metrics and Analytics Models to Master
A strong analytics function doesn't track everything equally. It tracks a small set of metrics thoroughly, then uses the right model for the question at hand.
Consider a doctor's toolkit. A thermometer, blood test, and scan all matter, but not for the same diagnosis. Marketing works the same way. CAC, LTV, conversion rate, cohort analysis, attribution, and mix modeling all answer different questions.
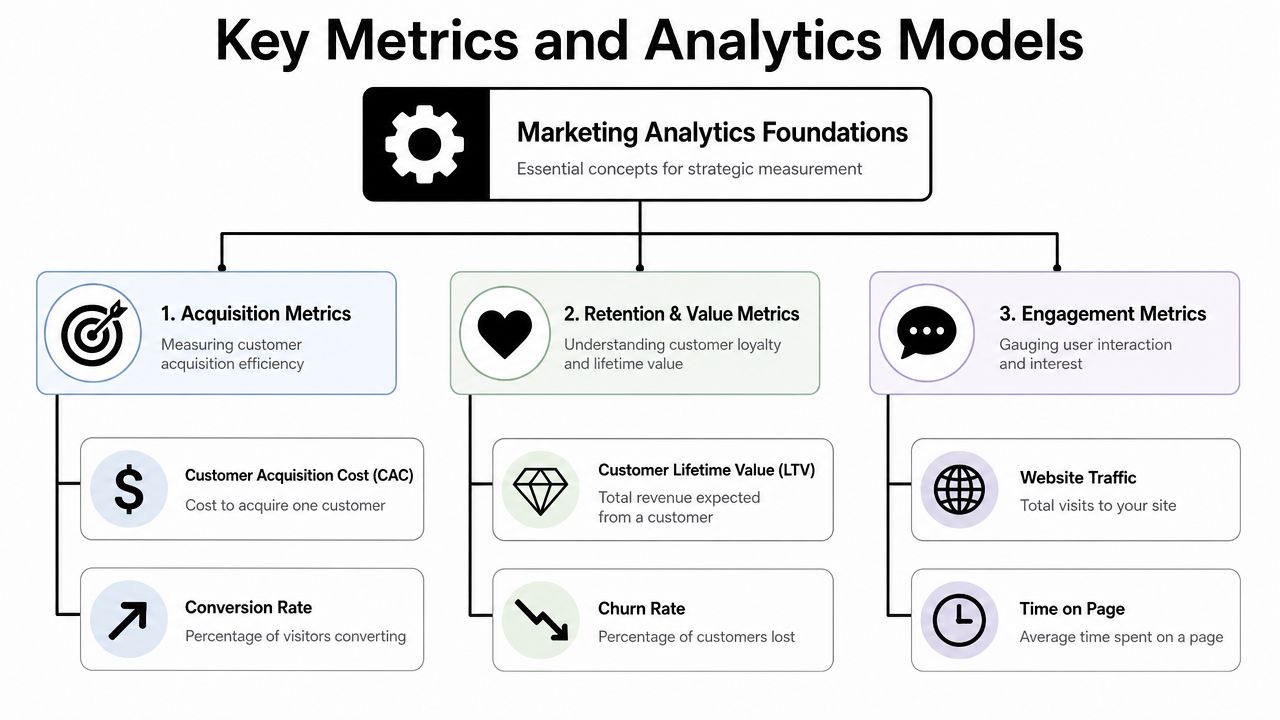
The metrics that actually guide decisions
Start with the metrics that have a direct line to action:
- Conversion rate: Useful for landing pages, offers, and funnel steps. On its own, it can still mislead if traffic quality changes.
- Customer acquisition cost: Best used comparatively across segments, channels, and time windows.
- Customer lifetime value: Critical for understanding whether acquisition efficiency is sustainable.
- Click-through rate: Helpful for diagnosing creative and message resonance, but never enough by itself.
- Website traffic: A directional metric, not a success metric, unless tied to intent and downstream behavior.
Those metrics matter because they connect performance to efficiency and value. If traffic rises while conversion quality falls, that's not growth. If CAC improves while LTV drops, that's not necessarily progress either.
Segment-level analysis changes the answer
Averages hide problems. They also hide opportunity.
A core practice in marketing data analytics is segment-level analysis. Practitioners should break KPIs such as CAC, LTV, or conversion rate across at least two dimensions like audience, device, geography, or funnel stage, then compare them over weekly, monthly, or quarterly windows to reduce day-to-day noise. That approach reveals structural performance differences and helps teams target high-yield cohorts instead of getting misled by blended averages, as described in Funnel's guidance on segment-level marketing data analysis.
Here's the operational takeaway:
- By audience: You may find one ICP converts at a lower rate initially but produces stronger downstream value.
- By geography: Regions often differ more in sales efficiency than in top-of-funnel response.
- By device: Mobile may drive clicks while desktop carries actual conversion intent.
- By funnel stage: The issue might not be acquisition at all. It may be qualification or routing.
If a KPI only looks healthy in blended form, check whether one strong cohort is masking multiple weak ones.
Models for different questions
Use different models based on what you need to know.
| Model | Best for | Limitation |
|---|---|---|
| Multi-touch attribution | Understanding channel contribution across the journey | Sensitive to identity gaps and platform fragmentation |
| Marketing mix modeling | Budget allocation across broader channel investments | Less granular for user-level behavior |
| Cohort analysis | Comparing retention and value by acquisition group or period | Depends on clean date logic and consistent definitions |
| Regression or classification approaches | Forecasting outcomes, scoring leads, and predicting conversion | Data quality problems can destabilize results |
Multi-touch attribution is useful when you need more than a last-click story. MMM is better when leadership asks where to shift budget at a higher level. Cohort analysis is often the clearest way to understand whether new customers are becoming more valuable over time or cheaper to acquire upfront.
The mistake is trying to make one model answer every question. The better approach is to maintain a small modeling toolkit and know when each method is trustworthy.
Building Your Marketing Data Pipeline
If analytics is the decision layer, the data pipeline is the plumbing behind it. When the plumbing is bad, every dashboard becomes a debate.
A pipeline should take raw data from marketing systems, standardize it, improve it, store it centrally, and make it available for analysis without manual heroics.
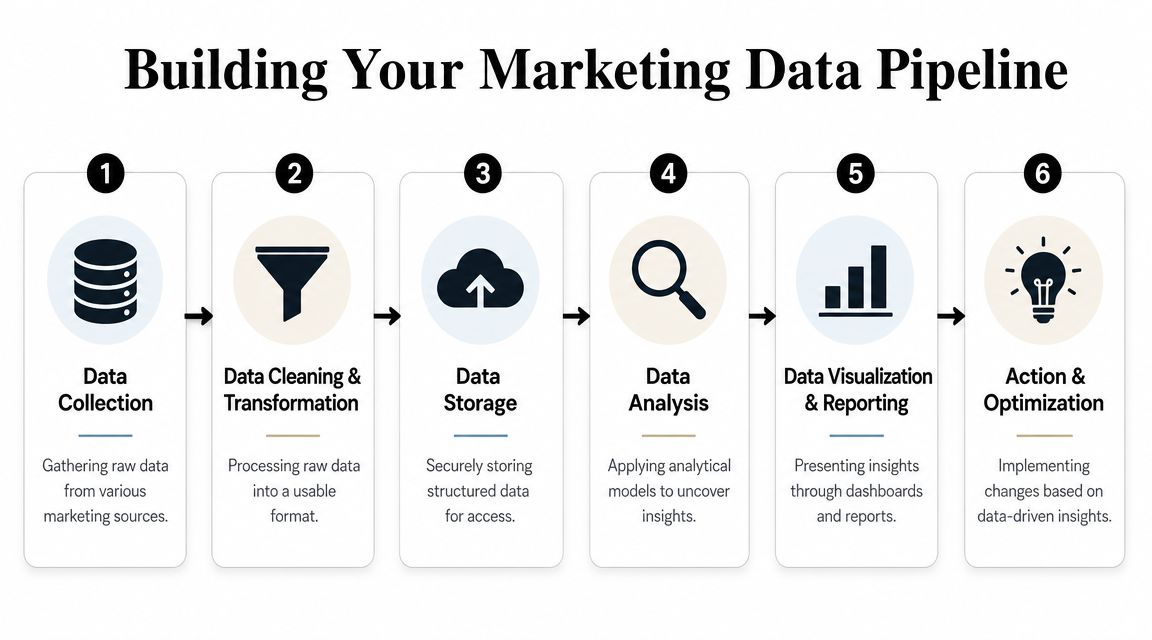
How data moves through the system
At a practical level, the flow looks like this:
Collection
Data enters from web analytics, CRM, ad platforms, product events, support tools, billing systems, and offline inputs.Loading
Raw records move into a warehouse such as BigQuery or Snowflake. At this stage, speed matters more than perfection.Transformation
In this stage, most of the hard work occurs. Teams standardize fields, deduplicate records, map identities, normalize campaign naming, and join tables that were never designed to work together.Modeling and analysis
Once the data is trustworthy, analysts build KPI layers, funnel views, attribution views, cohorts, and forecasts.Distribution
Dashboards, alerts, scorecards, and operational workflows push the data back to the people who need it.
This short walkthrough is helpful if your team is still designing architecture: marketing data platform basics.
Where pipelines usually break
Most failures don't come from the warehouse. They happen earlier.
- Tracking inconsistency: UTM formats drift. Campaign names change mid-flight. Key events aren't versioned.
- Identity mismatch: The same person appears under multiple emails or across anonymous and known sessions with no clean join logic.
- Incomplete source data: Forms collect too little. CRM ownership is patchy. Company fields are free text.
- Late validation: Teams discover duplicates, outliers, and missing values after leadership has already reviewed the dashboard.
Predictive marketing analytics becomes much more useful when it's built on centralized historical data and combined with methods like regression, classification, moving averages, or marketing mix modeling. The same guidance also stresses quality checks for missing values, duplicates, and outliers, because those defects distort averages, totals, and model stability in Digital Marketing Institute's discussion of predictive analytics for marketers.
Why enrichment belongs in the transform layer
Data cleaning fixes what's broken. Enrichment fills what's missing.
That difference matters. A cleaned lead record might remove duplicate emails and standardize company names. An enriched record adds missing company details, role context, and verified professional data that makes segmentation, routing, and analysis more useful.
That's why enrichment belongs in the transform layer, not only in outbound prospecting. If you care about lead quality analysis, account-based segmentation, or lifecycle scoring, you need complete records before the BI model gets built.
One customer metric that often benefits from this kind of pipeline discipline is satisfaction and advocacy tracking. If you're operationalizing survey feedback inside CRM and warehouse workflows, this practical guide to NPS formula insights for 2026 is a useful reference for structuring the score consistently.
Video can help make the architecture concrete before you document your own stack.
Clean pipelines don't just improve reporting. They reduce rework across marketing ops, RevOps, analytics, and sales.
Essential Tools and Integrations for Your Stack
The easiest way to evaluate a marketing analytics stack is by function, not by vendor list. Organizations often buy too many overlapping tools because they shop by category page instead of by workflow.
The stack by function
A workable stack usually includes four layers.
Source systems sit at the edge. That includes Google Analytics, ad platforms, CRM systems like Salesforce or HubSpot, product analytics tools, support platforms, and billing systems. Their job is to capture behavior and business events close to where they happen.
Storage and compute sit in the middle. BigQuery, Snowflake, Redshift, or similar warehouse layers fill this role. You want one place where marketing, sales, and customer data can be joined.
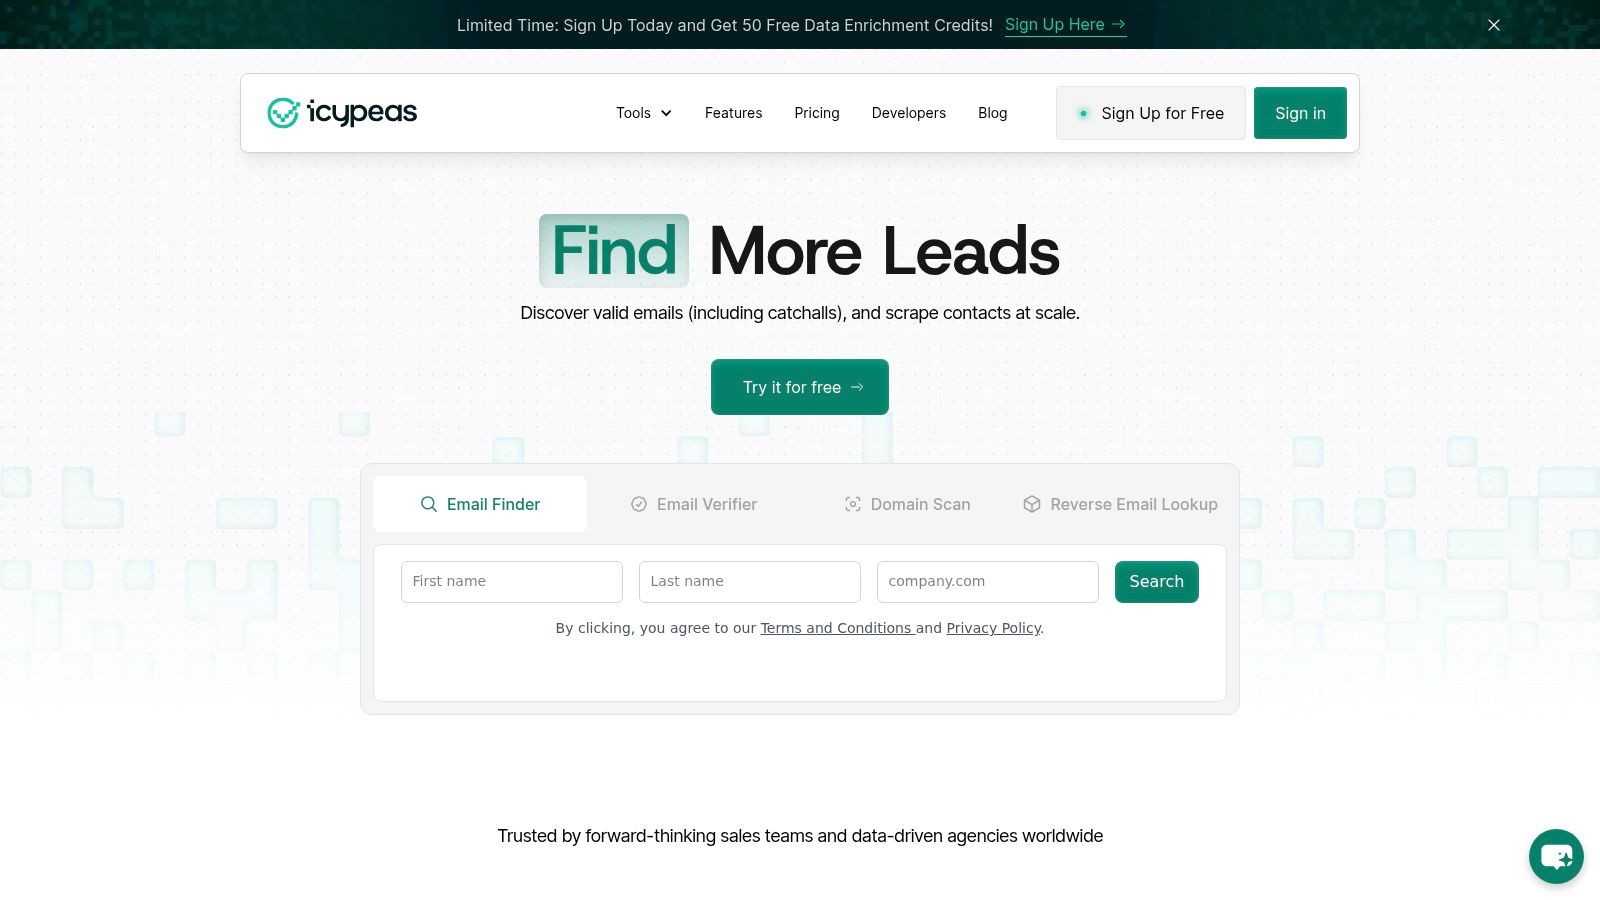
Transformation and enrichment make the raw data usable. This layer standardizes campaign values, resolves duplicates, maps identities, and improves records with missing company or contact fields. For teams that need professional contact and company enrichment in operational workflows, one option is Icypeas, which provides email finding, verification, reverse email lookup, and company or people data that can feed CRM and analytics processes.
BI and decision layers sit on top. Looker, Tableau, Power BI, and similar tools turn modeled datasets into dashboards, scorecards, and operating views for marketers and executives.
If you're comparing categories and trying to avoid tool sprawl, this roundup of marketing analytics software options is a useful planning reference.
What to evaluate before you buy
Don't ask whether a tool has dashboards. Almost all of them do. Ask whether it strengthens the whole chain.
Use criteria like these:
- Integration depth: Can it connect to the systems where your real funnel data lives?
- Data export flexibility: Can you get clean data out, not just charts in the app?
- Identity handling: Does it support joins across anonymous behavior, leads, contacts, and accounts?
- Governance: Can your team control definitions, permissions, and refresh logic?
- Enrichment value: Does it improve segmentation and routing, or just add another interface?
For messaging and customer communication tooling, product choice also affects what data becomes available to analytics. If your team is weighing support versus outbound engagement workflows, this comparison of Intercom vs Drast for B2B sales) is a practical example of how tool roles shape the data you can capture and analyze later.
Buy fewer tools that integrate well. A slightly less flashy stack with clean handoffs will outperform a fragmented one every time.
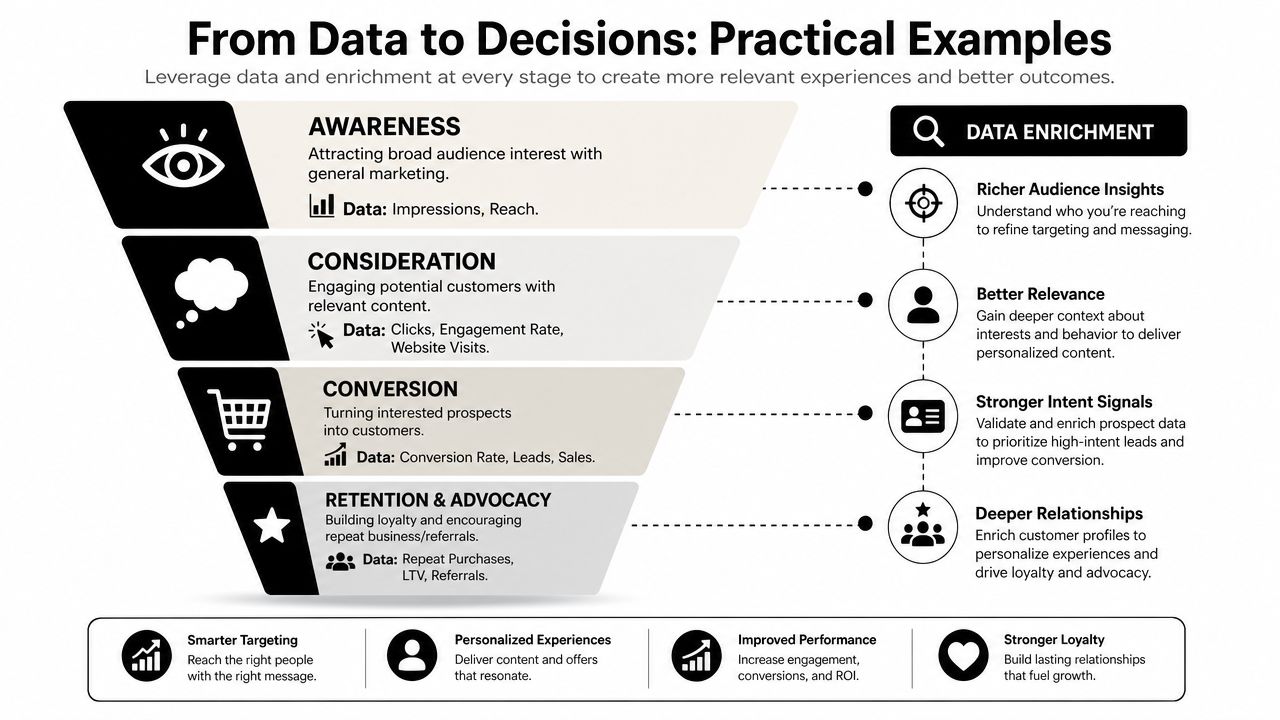
From Data to Decisions Practical Examples
Good marketing data analytics should change what a team does next. If it only produces retrospective commentary, it's underperforming.
Example one B2B inbound and enriched routing
A B2B SaaS team runs paid search, content syndication, and demo forms into the same CRM. On paper, inbound volume looks healthy. In reality, sales complains that follow-up quality is inconsistent and qualification rates are unpredictable.
The first issue isn't the dashboard. It's the record quality.
Many inbound leads arrive with a work email and a company name, but job title formatting is inconsistent, industry data is missing, and account ownership rules depend on fields that only exist for part of the database. As a result, routing logic malfunctions. High-fit leads land in generic nurture flows. Weak-fit leads get immediate SDR attention.
The fix starts in the data layer:
- Normalize company names so duplicates don't split account history.
- Verify professional contact fields before sales sequences use them.
- Enrich inbound records with role and company context to support scoring.
- Push standardized attributes back into CRM and marketing automation.
Once that happens, the team can build cleaner segments, route by fit, and personalize sales outreach based on firmographic context instead of guesswork. The analysis becomes more trustworthy because records now describe actual buyers, not partial forms.
This matters even more as modeling gets more advanced. A foundational shift in marketing analytics is the move from descriptive reporting to AI-enabled prediction and automation. In 2026, 56% of organizations reported using AI analytics, up from 31% in 2024, and adopters said it delivered 64% faster time-to-insight plus 28–35% better forecast accuracy than traditional statistical methods. The same source says enterprise use of integrated multi-touch attribution and marketing mix modeling reached 27% in 2026, up from 14% in 2024, which shows growing demand for richer, more integrated measurement in Improvado's review of top marketing analytics trends.
That trend only helps teams with data they can trust. AI doesn't rescue broken records. It scales whatever quality you feed it.
Example two ecommerce segmentation and value modeling
An ecommerce brand has plenty of purchase data, but customer value analysis keeps flattening everyone into one average. Paid social looks efficient. Search looks expensive. Retention campaigns are evaluated on broad revenue lift that doesn't explain which customers are becoming more valuable.
A better approach is to stop analyzing the entire customer base as one unit.
The team creates cohorts by acquisition source, first purchase category, discount behavior, and repeat purchase timing. Then it layers in enriched customer and account context where available, especially for higher-value or wholesale-adjacent segments. That creates a sharper view of which acquisition paths produce durable value and which only generate cheap first orders.
A few practical effects follow:
| Before | After |
|---|---|
| Paid channels judged mostly on first-order conversion | Channels judged by downstream customer value |
| Retention campaigns sent broadly | Lifecycle messaging targeted by cohort behavior |
| Budget debates driven by last-touch results | Budget decisions informed by segment quality and repeat value |
The point isn't that every brand needs a complex model on day one. It's that data completeness determines how far you can go. Better segmentation supports better LTV logic. Better LTV logic supports better spend decisions. Better spend decisions improve the business, not just the dashboard.
If your team wants more ideas on how research quality affects outreach and qualification upstream, these lead research articles are a useful companion read.
Implementation Roadmap and Common Pitfalls
A practical rollout works best in stages. Teams usually fail when they try to jump straight to advanced modeling before they've fixed naming, identity, and data hygiene.
Crawl walk run
Crawl starts with the basics. Get tracking in place, define your core funnel metrics, standardize campaign naming, and make sure CRM stages are usable. If teams argue over definitions every week, stop there and fix that first.
Walk means centralizing data and introducing segmentation. Bring your major sources into a warehouse, build shared KPI logic, and break performance down by audience, geography, device, or funnel stage. At this point, data cleaning and enrichment begin to pay off operationally.
Run is where forecasting, scoring, attribution blends, and automation become realistic. Only move here once your historical data is stable and your teams trust the base layer.
Pitfalls that slow teams down
Use this as a simple review checklist:
- Siloed systems: If ad, CRM, and product data live separately, you'll keep getting partial answers.
- Unvalidated inputs: Missing values, duplicates, and outliers will subtly corrupt analysis.
- Vanity metrics: High traffic and click volume can hide weak commercial performance.
- Overreliance on one attribution view: No single model should dictate every budget decision.
- Compliance blind spots: GDPR and CCPA obligations affect how data is collected, stored, enriched, and activated.
- Too much complexity too early: A stable weekly review with reliable numbers beats a fragile “advanced” model nobody trusts.
The best implementation plans aren't flashy. They're disciplined. They make the data more usable each month, then expand the questions the business can answer with confidence.
If your team is trying to improve segmentation, lead quality, CRM completeness, or the reliability of downstream analytics, Icypeas is worth evaluating as part of the enrichment layer. It helps teams find, verify, and enrich professional contact and company data so the records feeding your models, routing rules, and dashboards are more complete before decisions get made.


.png)


.webp)