.avif)
What Are Sales Forecasts for B2B Teams


.avif)
Your quarter closes in two weeks. Finance wants a revenue number they can trust. Sales managers are rolling up commits that changed twice this week. A few large deals look healthy in the CRM, but reps admit some contacts have gone dark, one buyer changed jobs, and another champion's email is bouncing. The forecast still says those deals are likely to land.
That's the moment many B2B teams realize they don't just have a forecasting problem. They have a data quality problem hiding inside a forecasting problem.
A sales forecast should help leaders decide how aggressively to hire, where to focus pipeline reviews, and whether next quarter's plan is grounded in reality. But if the inputs are stale, incomplete, or overly optimistic, the forecast becomes a polished version of guesswork. That's why understanding what sales forecasts are means looking beyond formulas and dashboards. You also need to understand the quality of the contact and pipeline data feeding them.
Table of Contents
- Sales Forecasts Overview
- What a sales forecast actually does
- Forecasts are planning tools, not promises
- When qualitative forecasting makes sense
- How quantitative methods differ
- Why mixed methods usually work better
- Start with inputs you can defend
- Choose a model that fits your reality
- Validate and refine on a regular rhythm
Sales Forecasts Overview
A sales leader at a mid-market B2B company walks into the Monday forecast call with three numbers. The rep roll-up says one thing. The manager adjustment says another. Finance has a third version built from historical performance. By Wednesday, one late-stage deal slips, another expands, and the quarter suddenly looks different again.
That chaos isn't unusual. 79% of sales organizations miss their quarterly forecast by 10% or more, and only 33% of sales leaders say forecast accuracy stays consistent from quarter to quarter, according to sales forecasting statistics compiled by AMW Group. When forecasts swing, hiring plans, marketing budgets, and operating decisions swing with them.
What makes this frustrating is that these teams aren't lazy. They're working with mixed inputs. Some data lives in spreadsheets. Some sits in the CRM. Some reflects real buyer activity. Some is already outdated.
A useful forecast doesn't eliminate uncertainty. It gives your team a disciplined way to estimate future revenue, explain the assumptions behind it, and improve those assumptions over time. That starts with the basics.
Understanding Sales Forecast Fundamentals
A sales forecast is a structured estimate of future revenue over a specific period. In B2B, that usually means estimating how much business is likely to close this month, quarter, or year based on the opportunities you have, the patterns you've seen before, and the market signals you're watching now.

What a sales forecast actually does
The easiest way to understand what sales forecasts are is to compare them to a weather forecast. A weather app doesn't promise rain at exactly 3:17 p.m. It combines signals, patterns, and current conditions to estimate what's most likely next. Sales forecasting works the same way.
A practical B2B forecast usually draws from three sources:
- Pipeline data such as deal value, stage, expected close date, and rep activity
- Historical trends such as win rates, average cycle length, and seasonality
- Market signals such as buyer engagement, product usage, and changes in demand
When those inputs are clean and current, the forecast becomes a planning tool. When they're weak, the forecast turns into a pipeline wish list.
A forecast should answer, “What's likely to happen?” not “What do we hope happens?”
Forecasts are planning tools, not promises
Often, readers misunderstand. They assume forecasting is only for sales leaders trying to predict quota attainment. It isn't. Forecasts shape decisions across the business.
Finance uses forecasts to plan spending. Marketing uses them to understand whether pipeline generation needs to accelerate. RevOps uses them to spot conversion issues. Sales managers use them to decide which deals need intervention this week, not at the end of the month.
A strong forecast also creates a shared language between teams. Instead of arguing about gut feel, people can discuss assumptions. Is the stage probability too generous? Has the close date been pushed three times? Did the buyer respond this week?
That shift matters because what are sales forecasts really for if not to improve decisions before the quarter is over? The best teams treat forecasting as an operating system for judgment. They don't ask for certainty. They ask for a clearer view of risk.
Exploring Forecasting Types and Methods
Some teams forecast mostly by experience. Others use spreadsheets full of weighted deals. More mature teams combine statistical models with CRM data and machine learning. None of these approaches is universally right. The useful question is simpler. Which method fits your market, your data quality, and your sales motion?
To make the tradeoffs easier to see, compare the two broad families first.

When qualitative forecasting makes sense
Qualitative forecasting relies on informed judgment rather than large historical datasets. Common examples include Delphi panels and intuitive rep judgment.
This approach is useful when you're entering a new market, launching a new product, or working with limited history. In those cases, there may not be enough stable data for a strong statistical model. A sales leader might ask regional managers for bottom-up estimates, then pressure-test them against market context and known risks.
Qualitative forecasting is flexible, but it has a clear weakness. People tend to overestimate the probability of good outcomes, especially when compensation or internal pressure is involved.
How quantitative methods differ
Quantitative forecasting uses measurable inputs and repeatable logic. In B2B sales, the common methods include stage-weighted pipeline models, regression analysis, time series models for stable markets, and AI-driven predictive models.
Here's a simple comparison:
| Method | Best fit | Main input |
|---|---|---|
| Stage-weighted pipeline | Teams with a defined sales process | CRM stage probabilities |
| Regression analysis | Teams linking sales to business variables | Relationships between variables |
| Time series | Stable, pattern-rich environments | Historical sales over time |
| AI and ML models | Large, dynamic datasets | Multiple signals, including real-time changes |
Later-stage weighted pipeline forecasting is easy to understand. Regression helps when variables like ad spend or market conditions influence outcomes. AI models go further by ingesting multivariable data, including behavioral signals.
A short video can help if you want to see these ideas in practice.
Why mixed methods usually work better
In complex B2B environments, one method rarely captures the full picture. Optimal accuracy comes from combining 2–3 quantitative methods, specifically pipeline stage-weighted modeling, regression analysis, and AI or ML predictive models, according to ORM Tech's guide to sales forecasting.
That combination makes sense in practice. Stage weighting gives structure. Regression shows which variables matter. AI picks up patterns humans and simpler models miss.
Practical rule: Use one method for a baseline, another for context, and a third for early risk detection.
If your team asks, “What are sales forecasts supposed to include?” the honest answer is this. They should include enough perspectives to reduce blind spots, but not so many moving parts that no one trusts the output.
Key Metrics and Accuracy Measures
Teams often say a forecast was “good” or “bad” without defining what that means. That's a mistake. Forecasting gets better when you measure the gap between what you predicted and what happened.
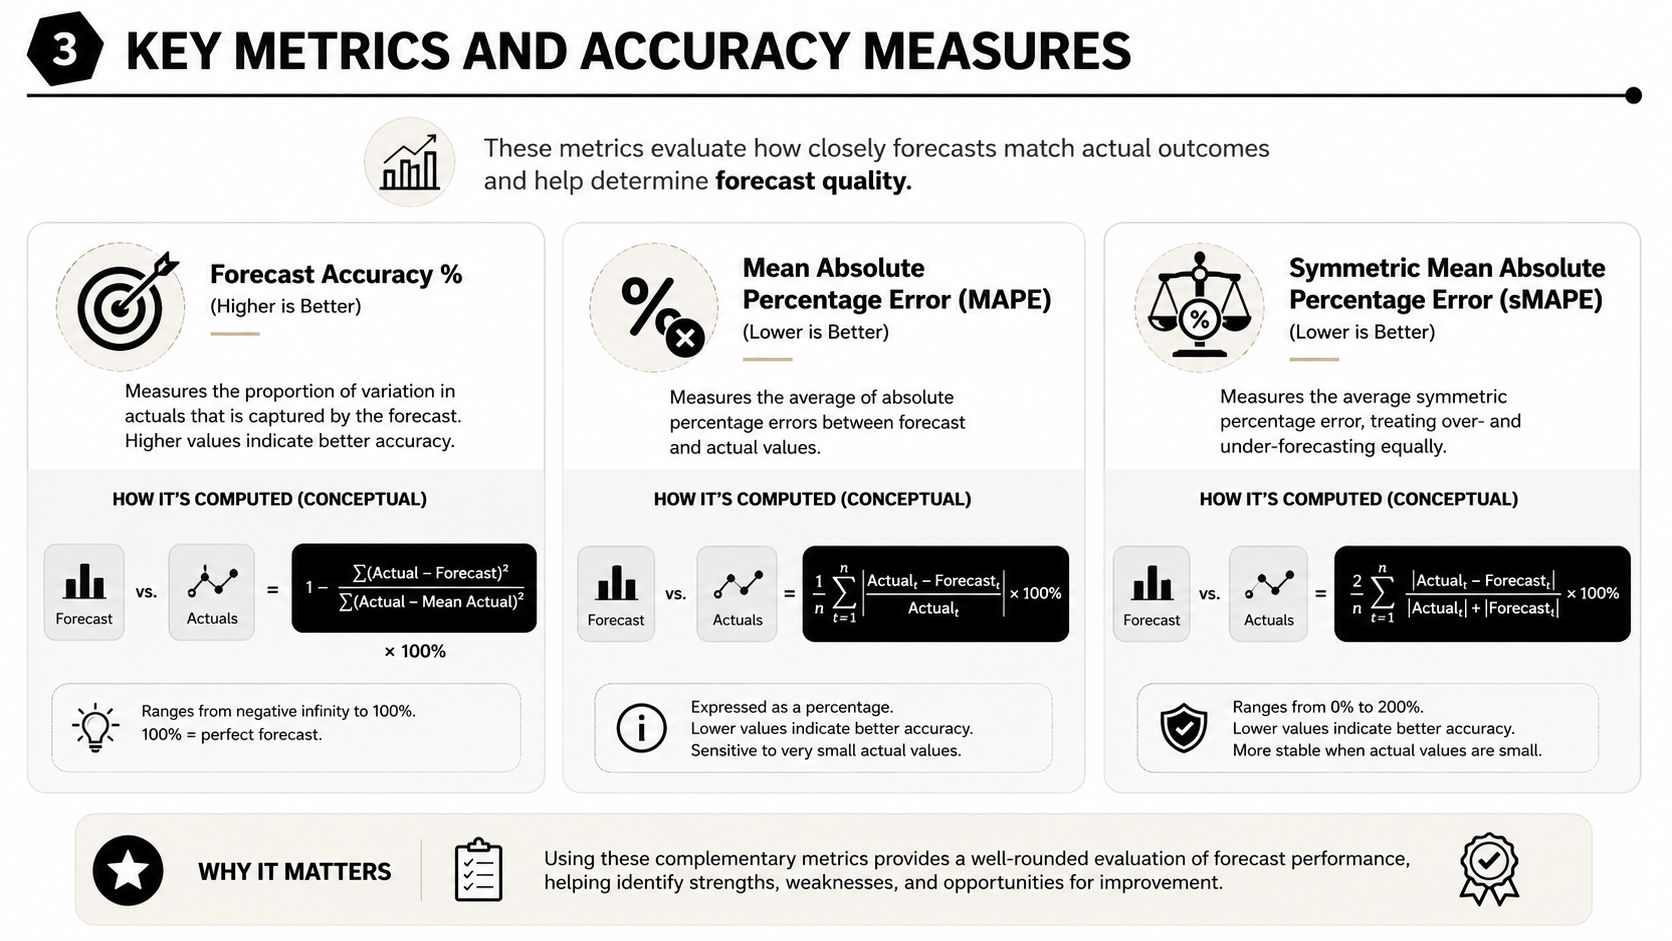
Three ways teams judge forecast quality
The most common measures are Forecast Accuracy %, MAPE, and sMAPE.
- Forecast Accuracy % compares forecasted revenue with actual revenue and shows how close the prediction was.
- MAPE stands for Mean Absolute Percentage Error. It focuses on the average size of the forecast error in percentage terms.
- sMAPE stands for Symmetric Mean Absolute Percentage Error. It helps reduce distortion when actual values swing sharply.
You don't need to be a statistician to use these. What matters is consistency. Pick a measure, calculate it the same way every period, and review it at the same level of detail. Team-wide accuracy can hide manager-level or segment-level problems.
A practical complement is a review framework. If you already track conversion, activity, and attainment in a structured way, a set of sales performance scorecard templates can make forecast conversations more concrete.
What good accuracy looks like in B2B
B2B forecasting accuracy typically falls between 60% and 90%, with results depending on process maturity, method choice, and data quality, according to Forecastio's analysis of sales forecasting accuracy. The same analysis notes that traditional predictive models often show ±15% variance, while predictive models using cleaned CRM data can reach ±3–5% variance.
That range tells you two important things.
First, no serious team expects perfect precision. Strong teams aim for reliable, repeatable accuracy. Second, data hygiene is not a side issue. Clean CRM inputs materially change forecast performance.
If your forecast accuracy drops suddenly, don't start by blaming the model. Check whether the underlying CRM data changed first.
For readers wondering what sales forecasts should be measured against, the answer is simple. Measure them against actual closed revenue, then slice the error by segment, rep, source, and time horizon. That's how you find whether the problem is process, pipeline, or data quality.
Building a B2B Forecasting Workflow
Forecasting breaks down when it lives as a heroic weekly exercise owned by one manager with a spreadsheet. It improves when the team follows the same workflow every cycle, uses the same definitions, and keeps the data clean enough to defend the output.
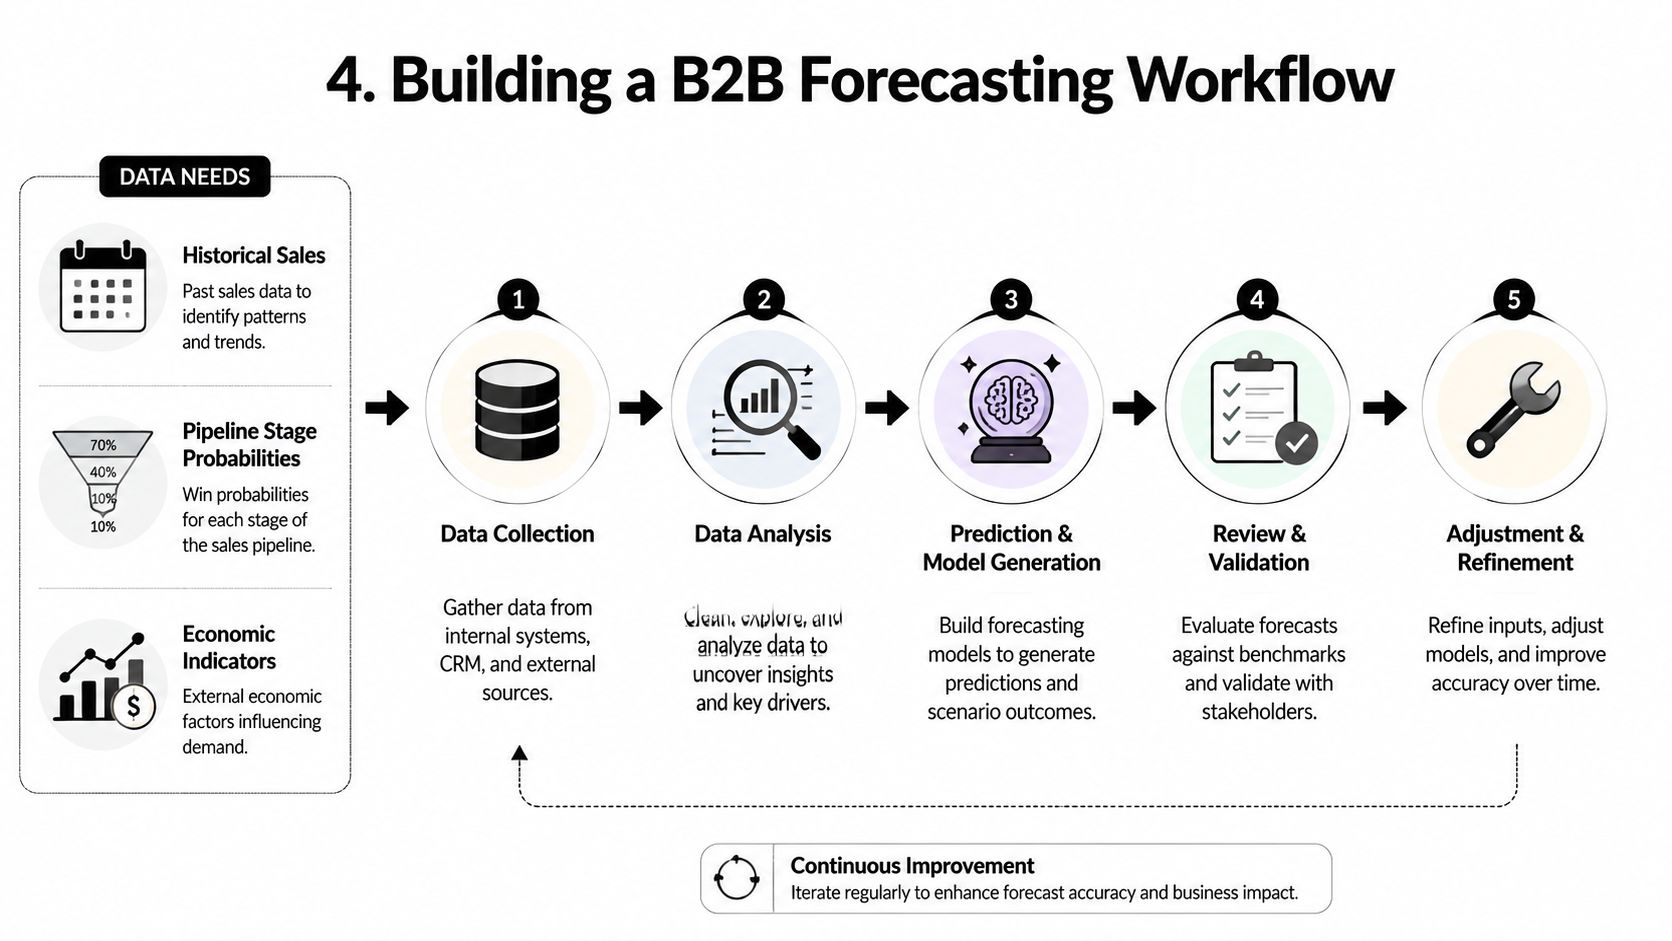
Start with inputs you can defend
Before you choose a model, gather the inputs you trust most. In most B2B teams, that means historical closed-won and closed-lost data, current open pipeline, stage movement history, and a short list of external factors that affect buying behavior.
Your CRM matters here. If records are scattered across spreadsheets, inboxes, and rep notes, forecast quality suffers fast. A connected system makes it easier to standardize stages, timestamps, ownership, and deal updates. If your team is still comparing tools or cleaning up a fragmented stack, this guide to types of CRM systems can help you think through the operational side.
Not every input deserves equal trust. Ask three questions of every field you plan to use:
Is it current
A close date untouched for weeks shouldn't drive a high-confidence forecast.Is it consistently defined
If one manager treats “proposal” as pricing sent and another treats it as a first draft, your stage data is noisy.Can someone verify it
Buyer engagement, recent calls, and confirmed stakeholders are more defensible than rep optimism.
Choose a model that fits your reality
The model should fit the business, not the other way around. Qualitative methods work when history is thin or the market is shifting quickly. Quantitative methods work when patterns are stable enough to model. AI and machine learning fit larger, more dynamic datasets.
The technical side matters more than many teams realize. Before modeling, organizations need to scrub anomalies, fill missing values, and ensure regular data intervals so they can separate trend, seasonality, and residual noise, as explained in Osher's overview of sales forecasting techniques.
That sounds technical, but the operational meaning is straightforward:
- Scrub anomalies so one unusual deal doesn't distort the model
- Fill missing values so the forecast isn't built on holes
- Normalize time intervals so month-over-month and quarter-over-quarter patterns are comparable
A simple working stack might include CRM exports, Python or R for modeling, and a BI dashboard for review. The tool matters less than the discipline.
Forecasting works best when every number can be traced back to a field, a rule, or a documented assumption.
Validate and refine on a regular rhythm
A forecast isn't finished when it's presented. It has to be tested against reality.
One practical workflow looks like this:
Weekly pipeline refreshes
Managers review deal movement, buyer activity, and close date changes.Monthly model checks
RevOps compares predicted outcomes with actuals and looks for drift in stage conversion or cycle length.Quarterly recalibration
Leadership updates assumptions, reviews where the forecast missed, and adjusts model weights or business rules.
Validation also means checking where the model is fragile. Maybe enterprise deals are overestimated. Maybe inbound pipeline forecasts well, but outbound doesn't. Maybe one region updates the CRM reliably and another does not.
A useful forecast review should include more than a top-line number. Include assumptions, segments at risk, and deals that look statistically healthy but operationally weak. If your model says a deal is likely to close but the buyer contact left the company, the model needs help from process.
This is the workflow. Gather credible data. Select a method that matches the business. Validate against actuals. Tighten the system every cycle.
Common Forecasting Pitfalls and Solutions
The most common forecasting failures don't come from bad math. They come from stale assumptions that teams stop questioning.
Static probabilities create false confidence
Many B2B teams assign a probability to each stage and keep using it long after buyer behavior changes. A deal in negotiation may still carry a high weight in the forecast even if the champion stopped responding, procurement introduced new friction, or legal review never started.
That becomes more dangerous over time. Pipeline-based forecasts lose 15–25% accuracy after 60 days because deal-stage probabilities are static and rarely updated with real-time buyer signals, according to Challenger's write-up on forecast accuracy.
The fix isn't to abandon stage-based forecasting. It's to make it less static.
- Refresh buyer signals weekly so probabilities reflect current engagement
- Recalibrate stage weights when win rates shift by segment or deal type
- Flag aging deals that keep the same stage but show no evidence of progress
Longer horizons need more skepticism
Quarterly forecasting often treats far-out opportunities as if their current state will hold. It won't. In longer cycles, buyer priorities change, contacts leave, budgets tighten, and internal approvals drift.
That means forecast confidence should decline as the horizon extends. Teams that ignore this usually overtrust distant pipeline and underinspect near-term execution risks.
A better habit is to split the forecast by confidence bands. Near-term deals with verified activity deserve more weight. Farther-out deals should be reviewed with tougher assumptions and more manager scrutiny.
The farther the close date, the more your team should rely on evidence instead of stage labels.
Many readers finally see what sales forecasts are not. They are not static spreadsheets updated before board meetings. They're living estimates that need constant correction.
Improving Forecast Accuracy with Enriched Data
A forecast can use the right method and still fail if the contact data underneath the pipeline is wrong. That's the blind spot most guides skip.
Bad contact data corrupts good models
If a late-stage opportunity is tied to an invalid email address, an outdated title, or a contact who no longer works at the account, the deal may still look healthy inside the CRM. The model sees a stage, an amount, and a close date. It doesn't automatically know the human buying path has broken.
That matters because 30% of B2B email lists contain invalid addresses, and pipeline built on unenriched contacts can create over 20% revenue projection errors, as noted in Pigment's end-of-year sales forecasting guide.
For outbound-heavy teams, this problem is easy to miss. Reps may continue working accounts that appear active on paper, while the actual buyer group has shifted. Forecasting then overstates opportunity quality because the pipeline itself is based on weak records.
A practical enrichment checklist
Enrichment improves forecasting because it improves the truthfulness of the pipeline. Start with the fields most likely to distort revenue projections.
- Verify work emails so activity metrics reflect reachable people, not dead inboxes
- Update job titles and roles so the forecast isn't counting deals tied to former champions
- Append firmographic details so routing, segmentation, and model assumptions match the account
- Check stakeholder coverage so single-threaded deals don't look stronger than they are
- Automate record refreshes so changes are captured before forecast reviews, not after
If your team is comparing options for keeping records current, this roundup of B2B data enrichment tools is a useful starting point.
The practical takeaway is simple. Forecast accuracy doesn't start in the forecast. It starts in the data collection, verification, and enrichment steps that define what the pipeline represents.
If your team wants cleaner inputs before the next forecast call, Icypeas helps you verify emails, enrich professional contact records, and keep CRM data usable for forecasting, outreach, and RevOps workflows.






















.png)



.webp)